Home Staging Report

2025 Profile of Home Staging cover featuring a staged modern living room and National Association of REALTORS® branding.

NAR research report page with a staged living room and staff names and titles.

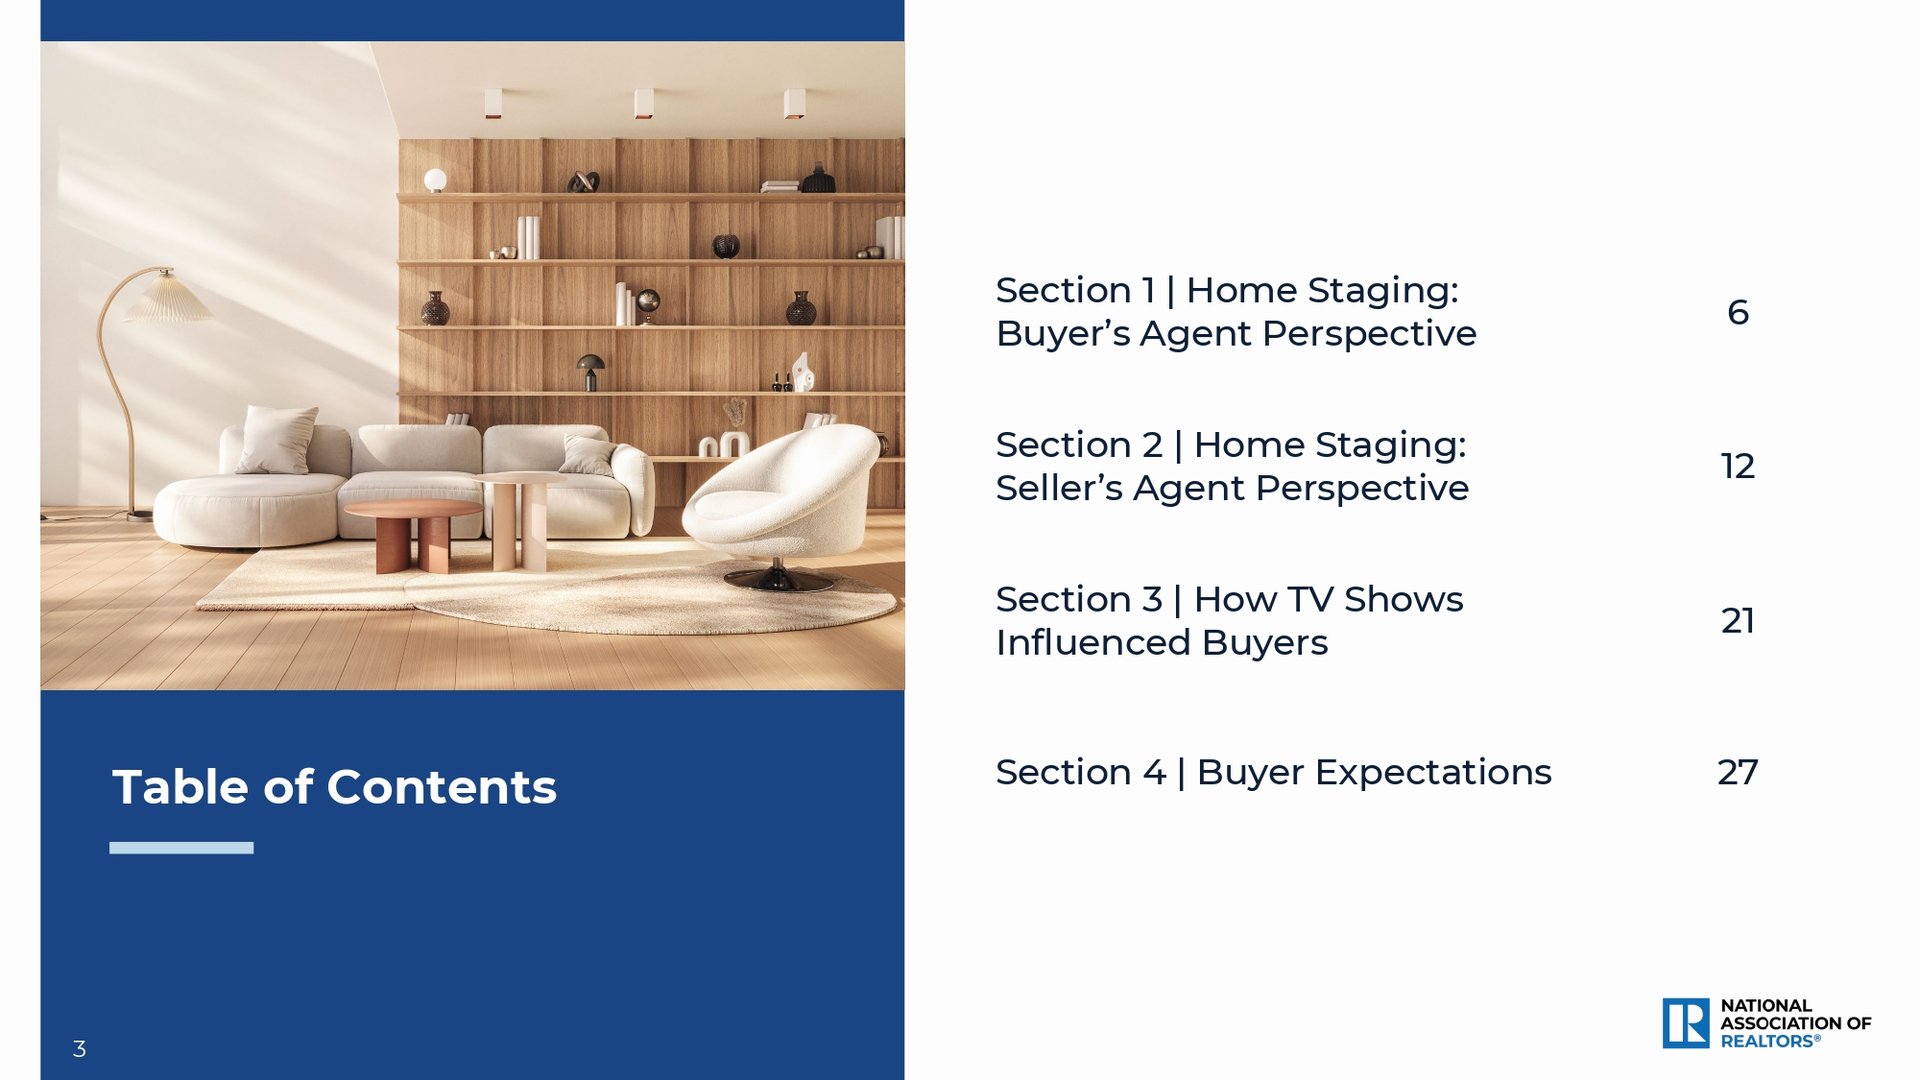
Home staging report contents page beside a sunlit living room with cream furniture and wood display shelves.

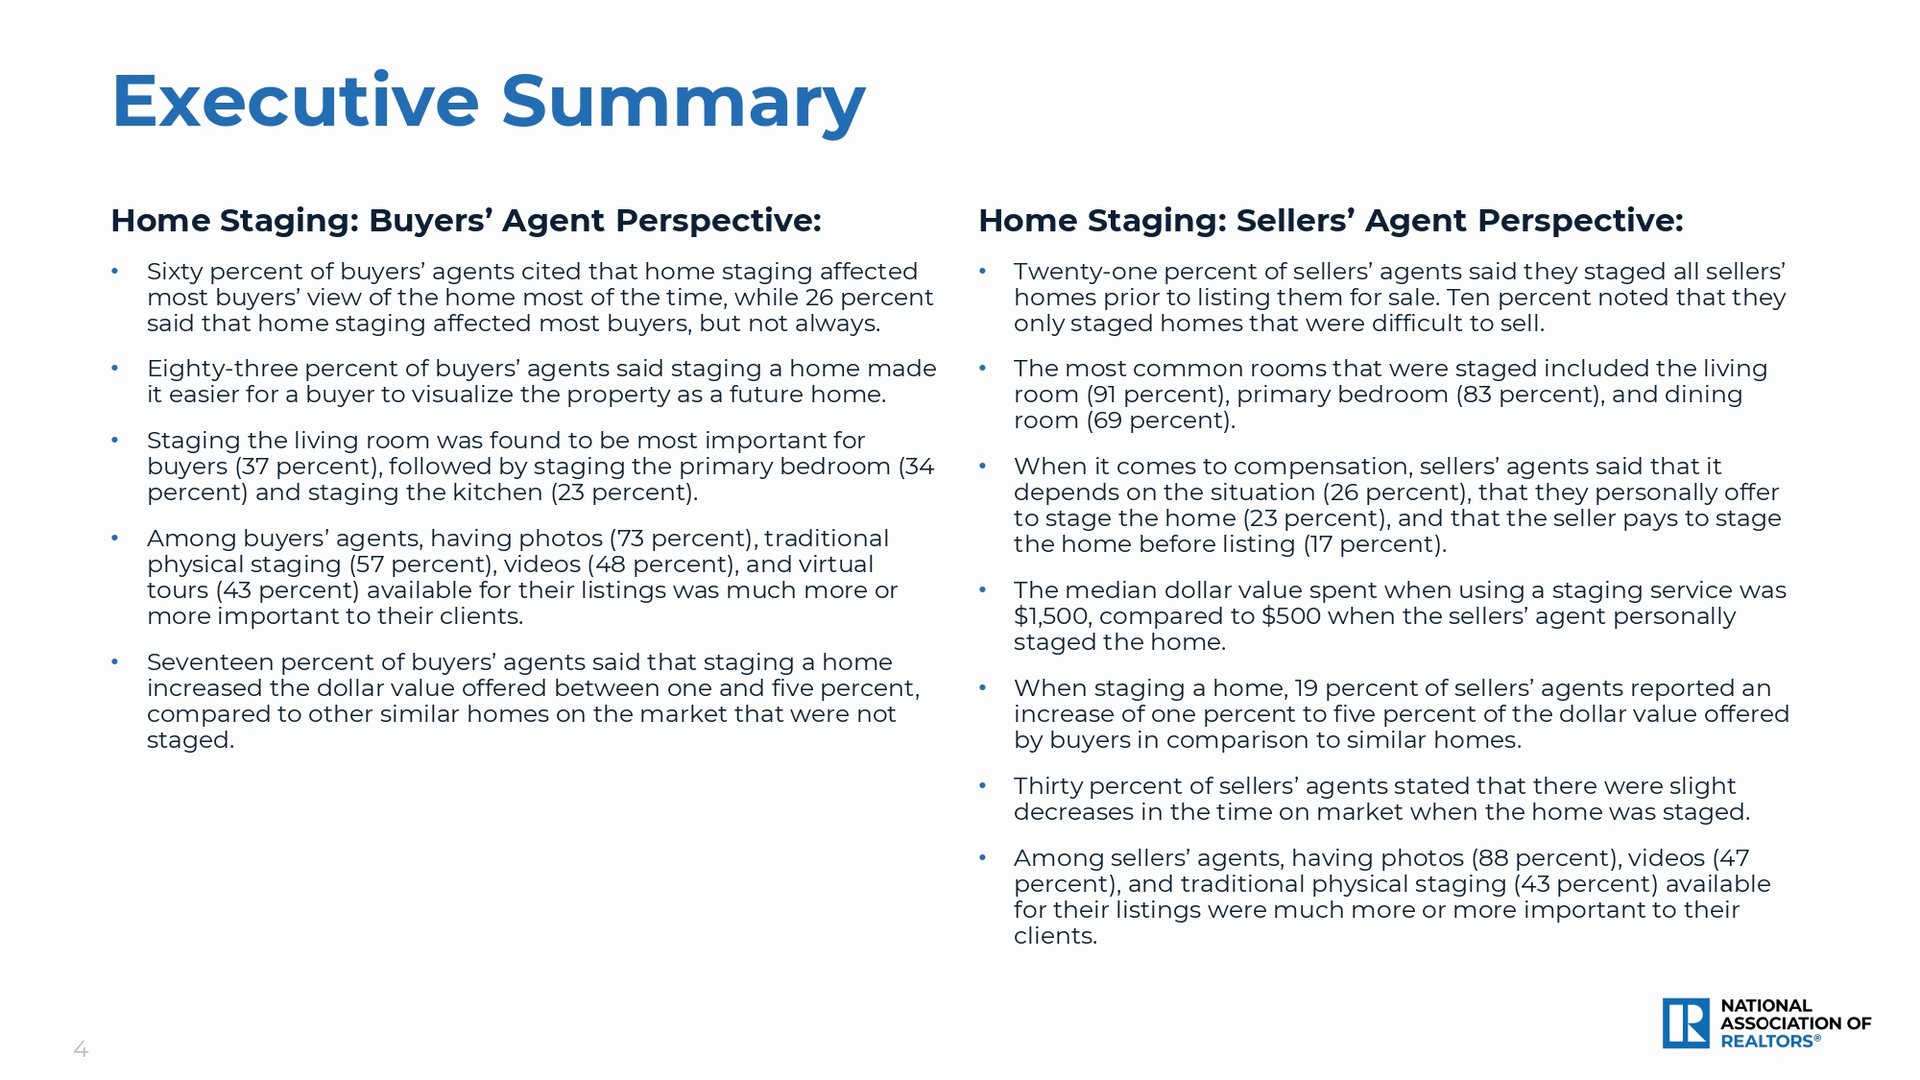
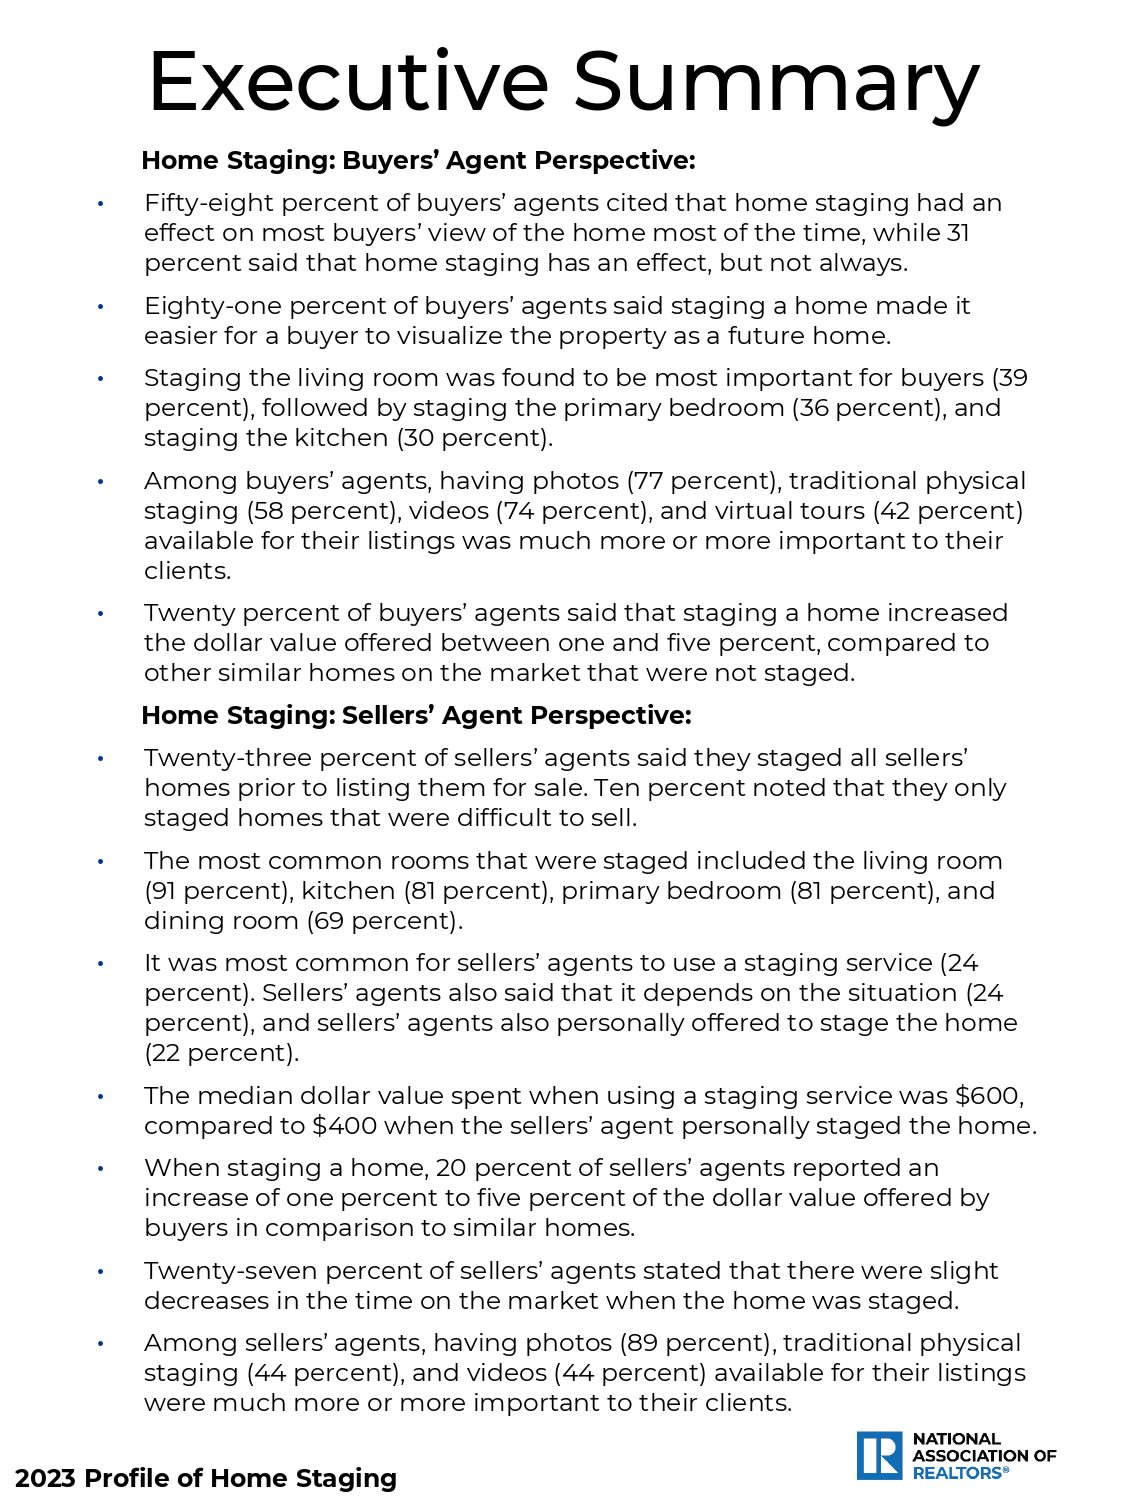
Executive summary of home staging findings from buyers’ and sellers’ agents.

Home staging: buyer’s agent perspective

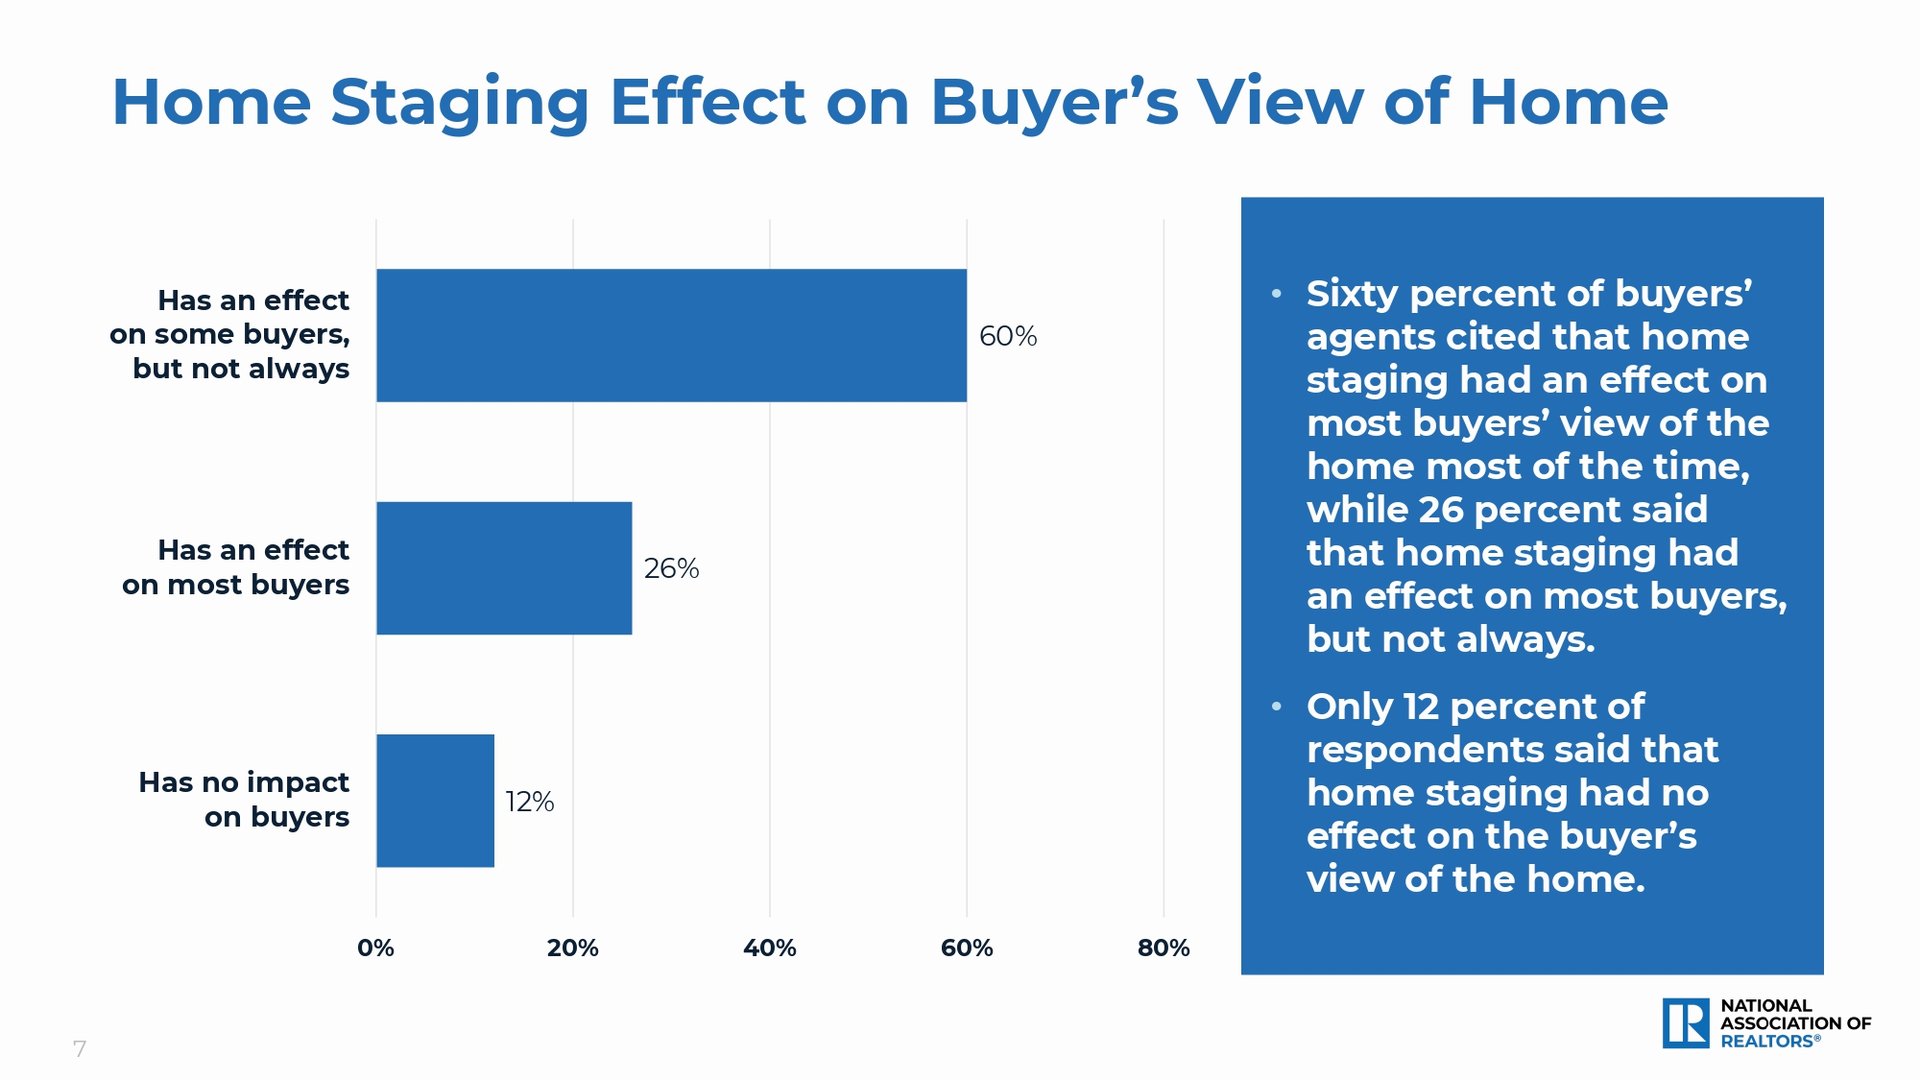
Infographic showing reported effects of home staging on buyers’ views, with bars at 60%, 26%, and 12%.

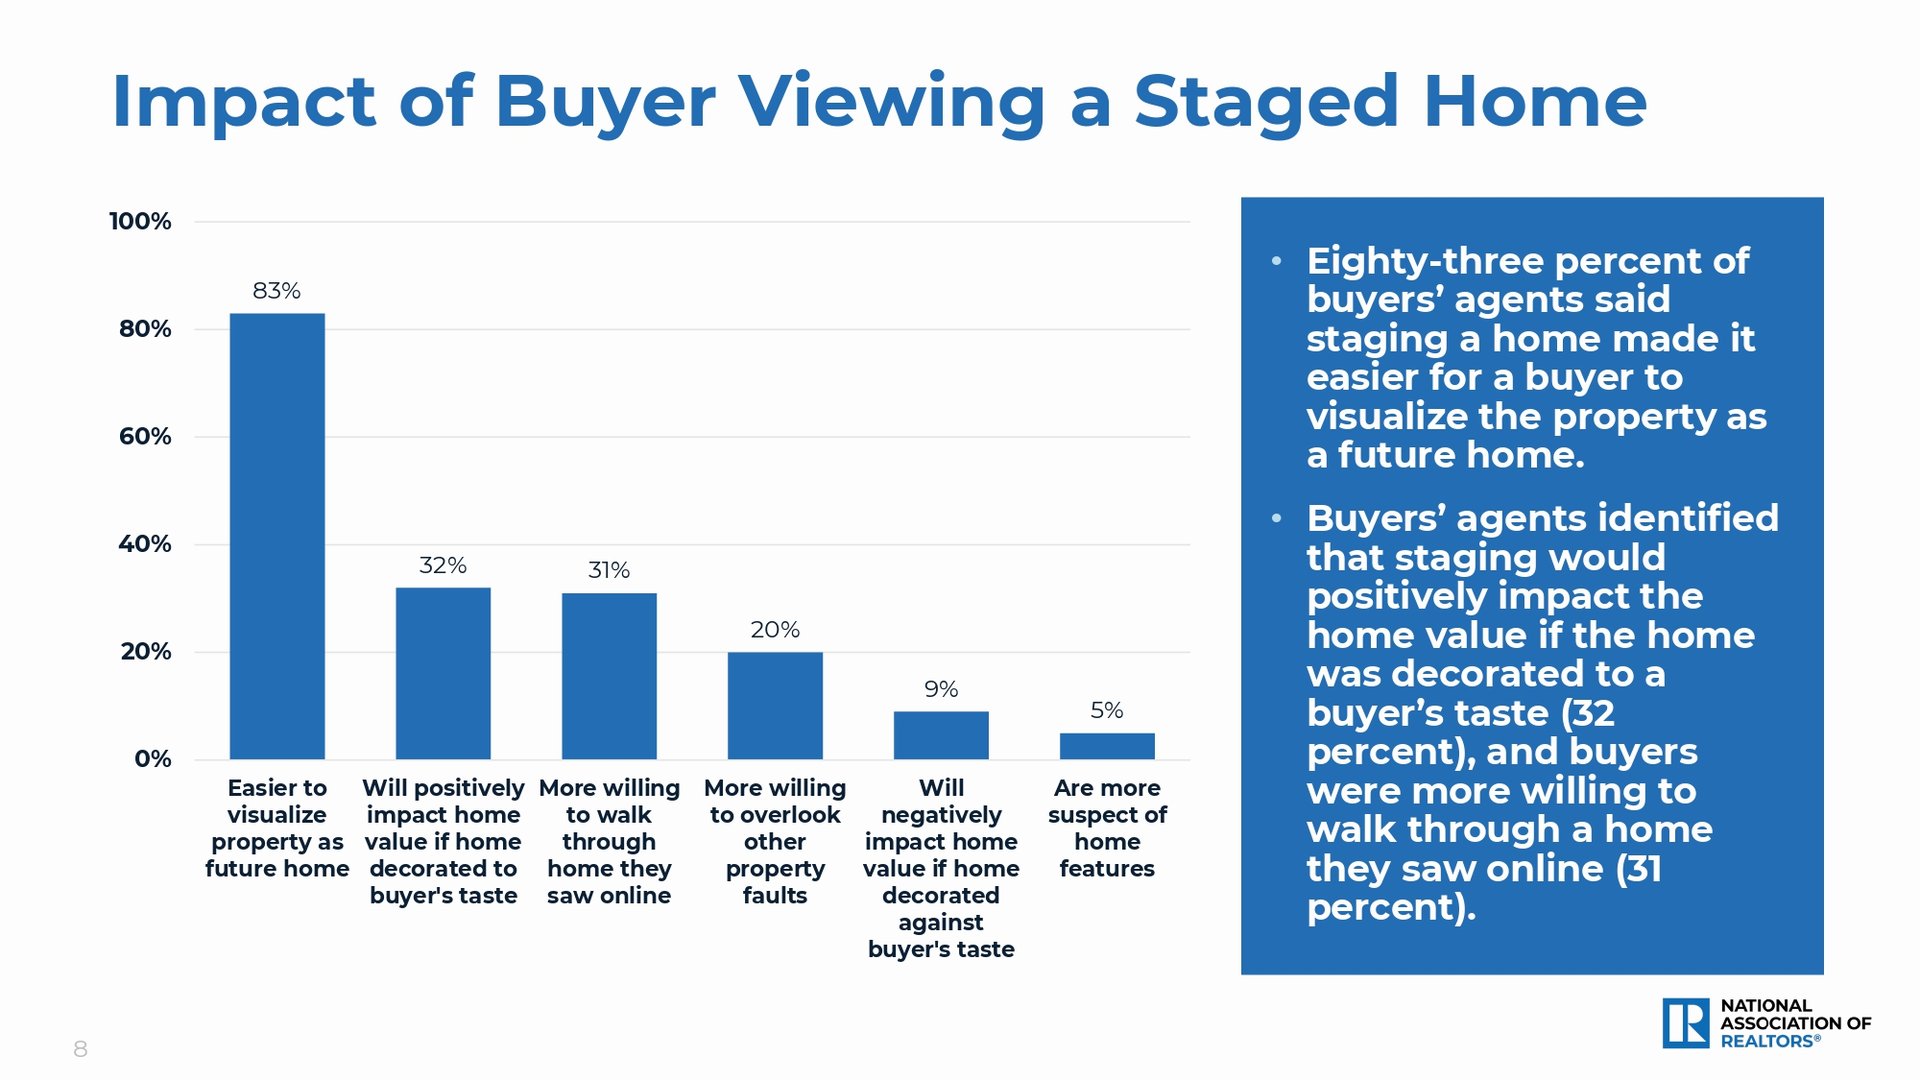
Chart: staging helps buyers visualize a future home (83%); 32% see value impact, and 31% are more willing to visit.

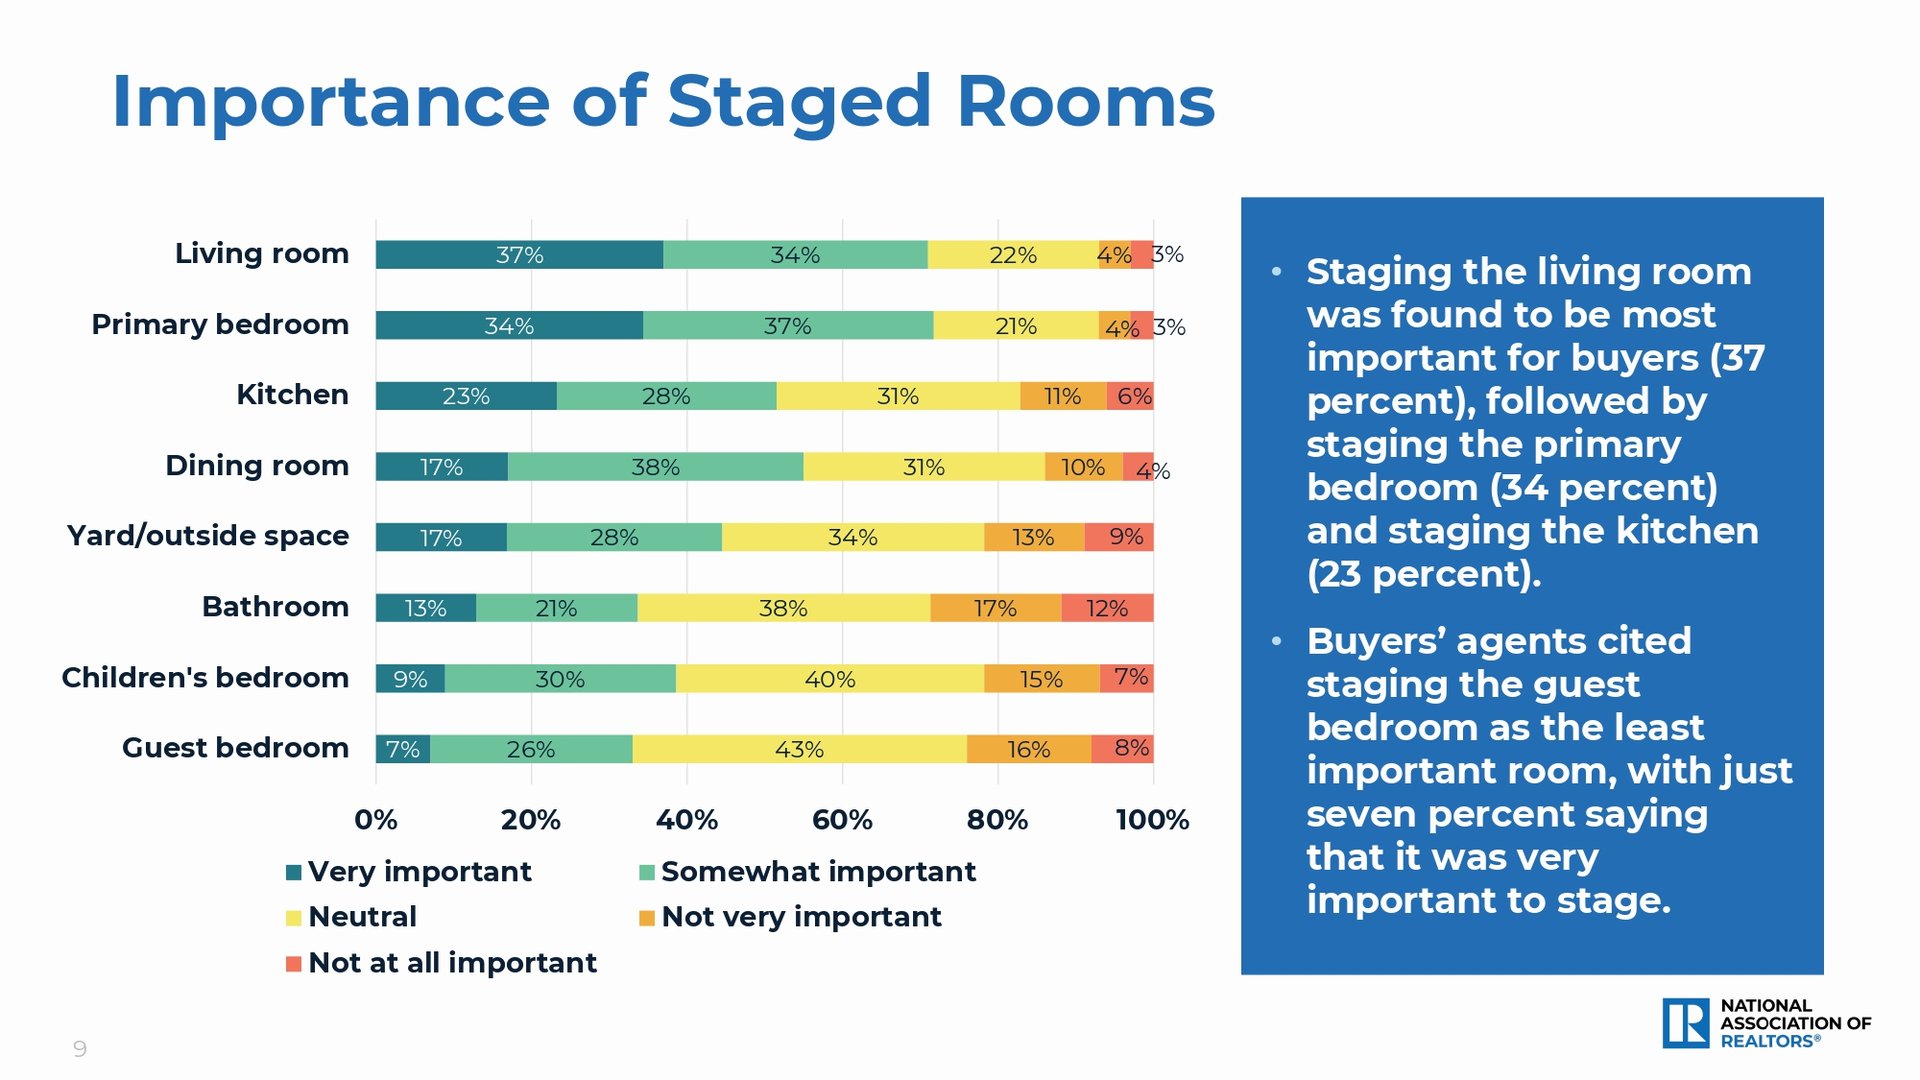
Infographic compares buyer views on staging eight rooms; living rooms rate highest and guest bedrooms lowest.

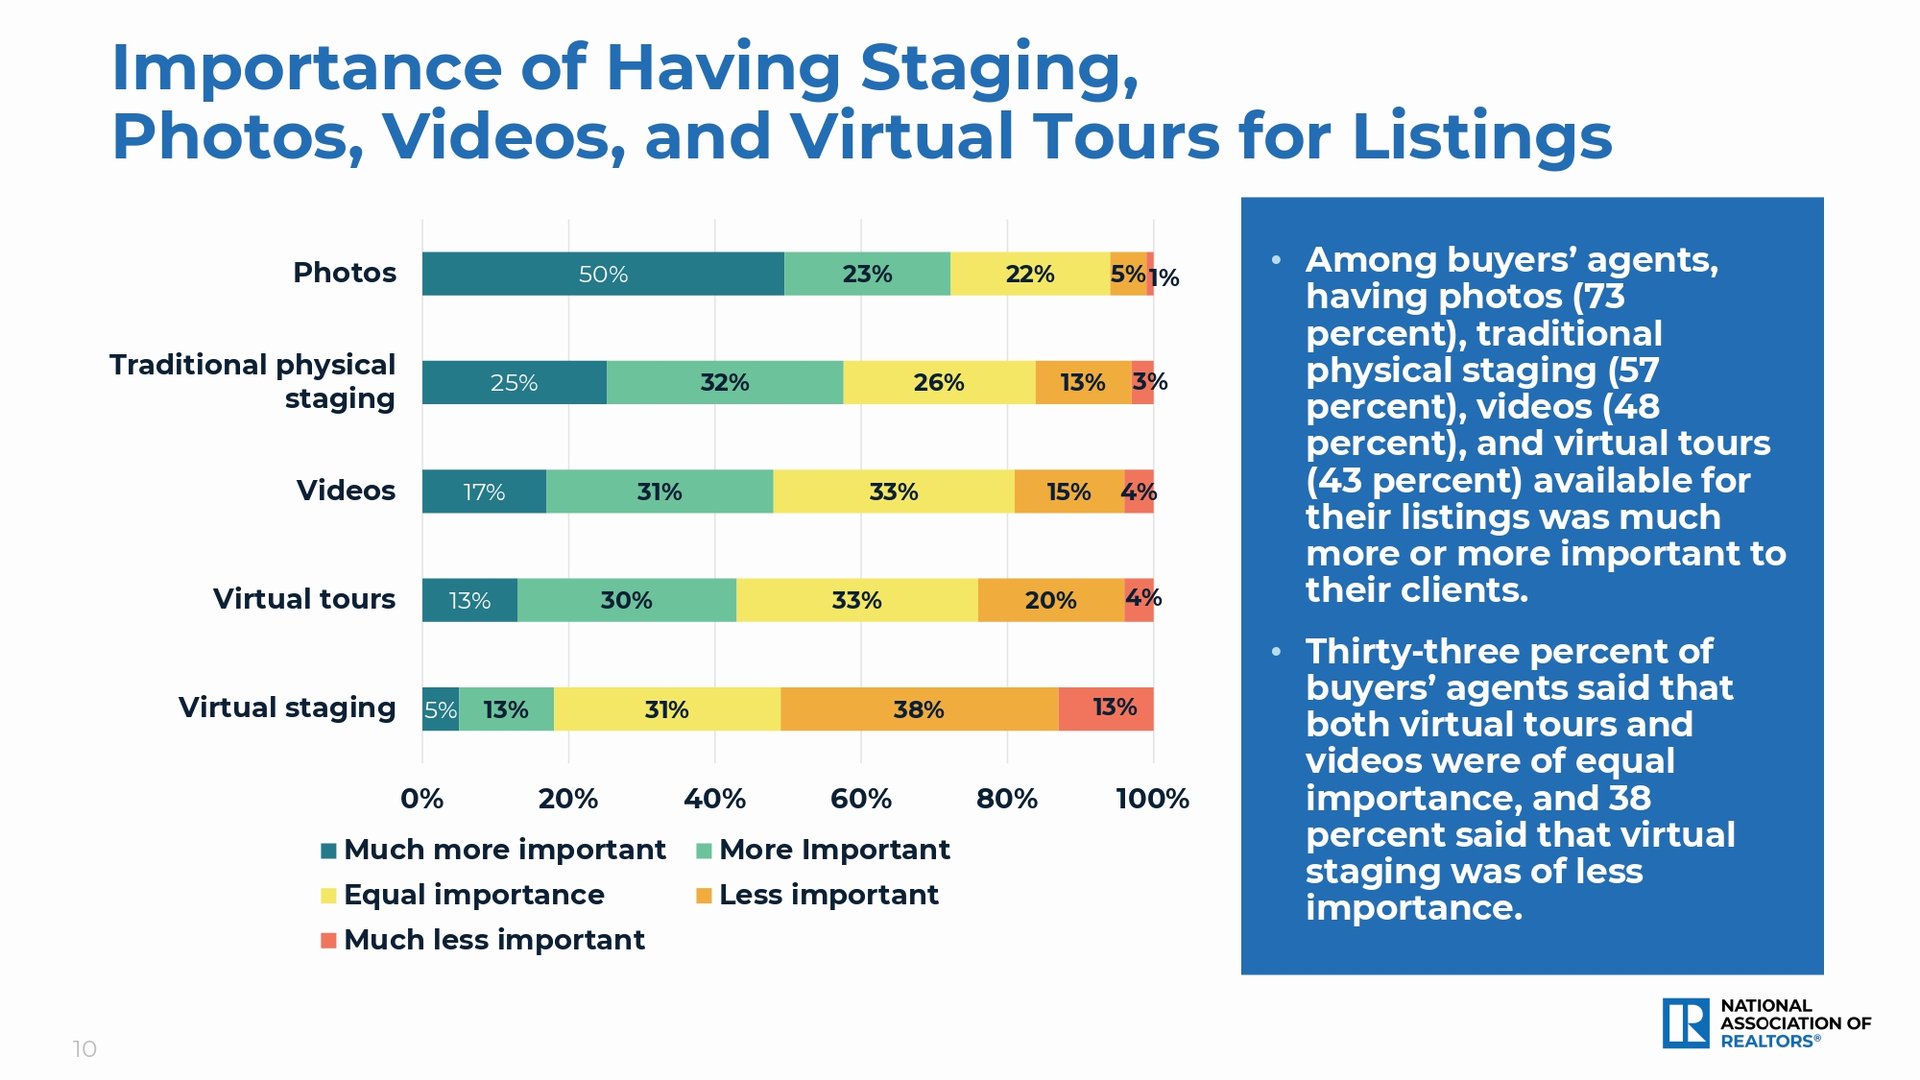
Chart comparing buyer agents’ views on the importance of listing photos, staging, videos, and virtual tours.

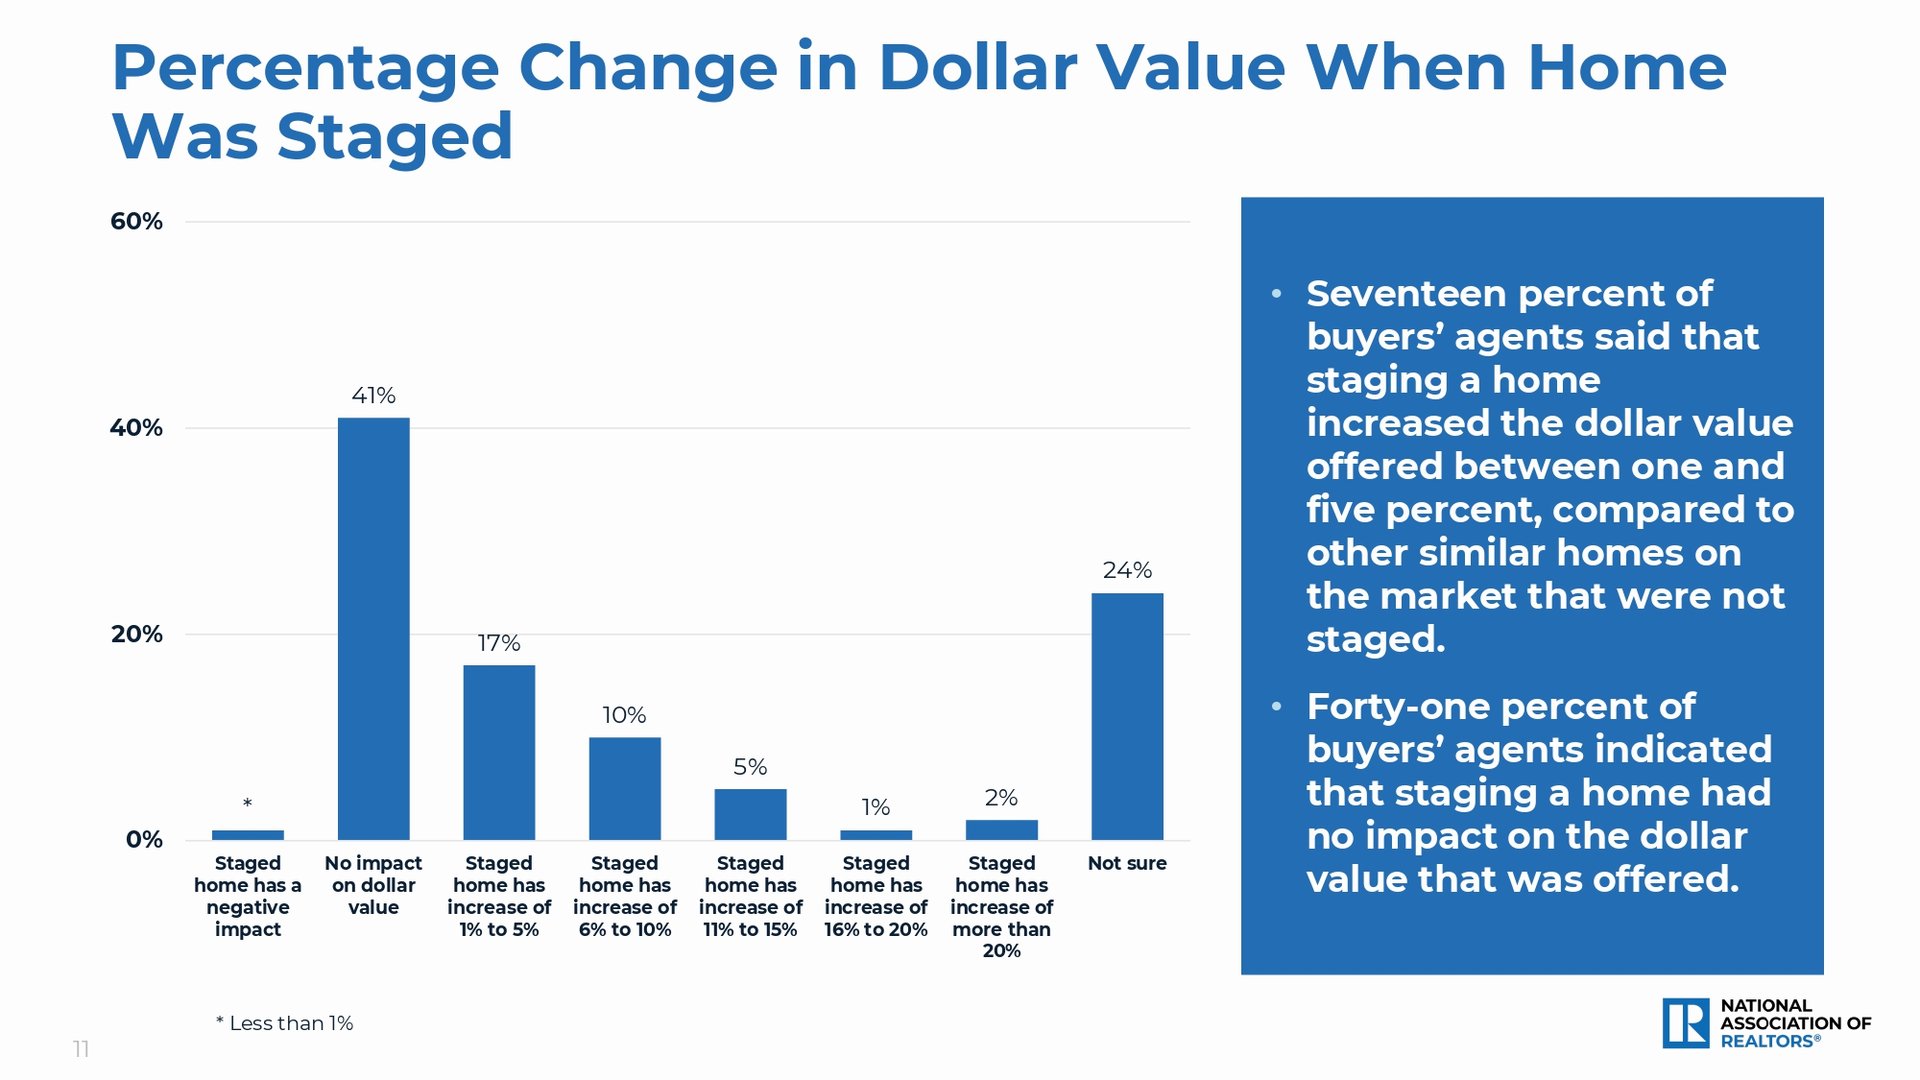
Chart of buyers’ agents’ views on home staging’s effect on dollar value, with 41% reporting no impact.

Staged contemporary bedroom with a sculptural upholstered bed and warm wood-slat accent wall.

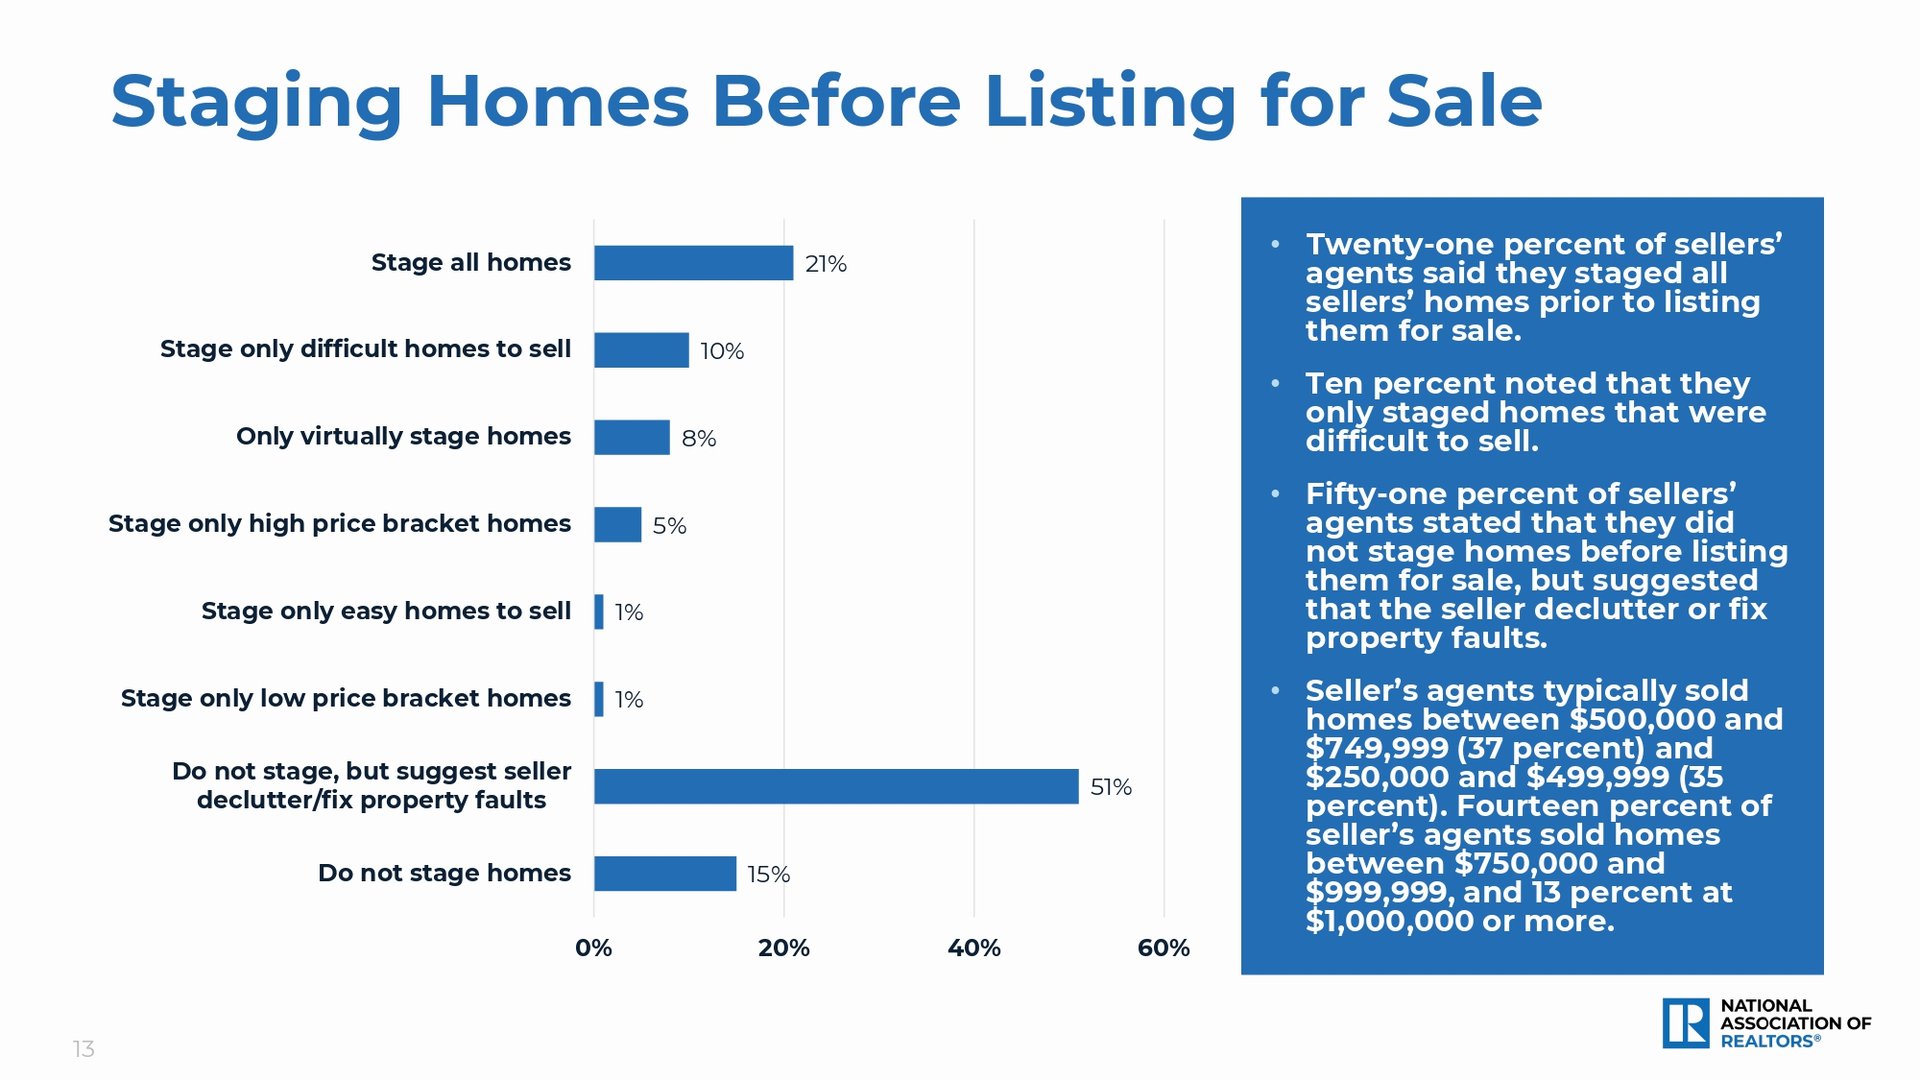
Infographic comparing home staging practices among sellers’ agents, with a horizontal bar chart and statistics.

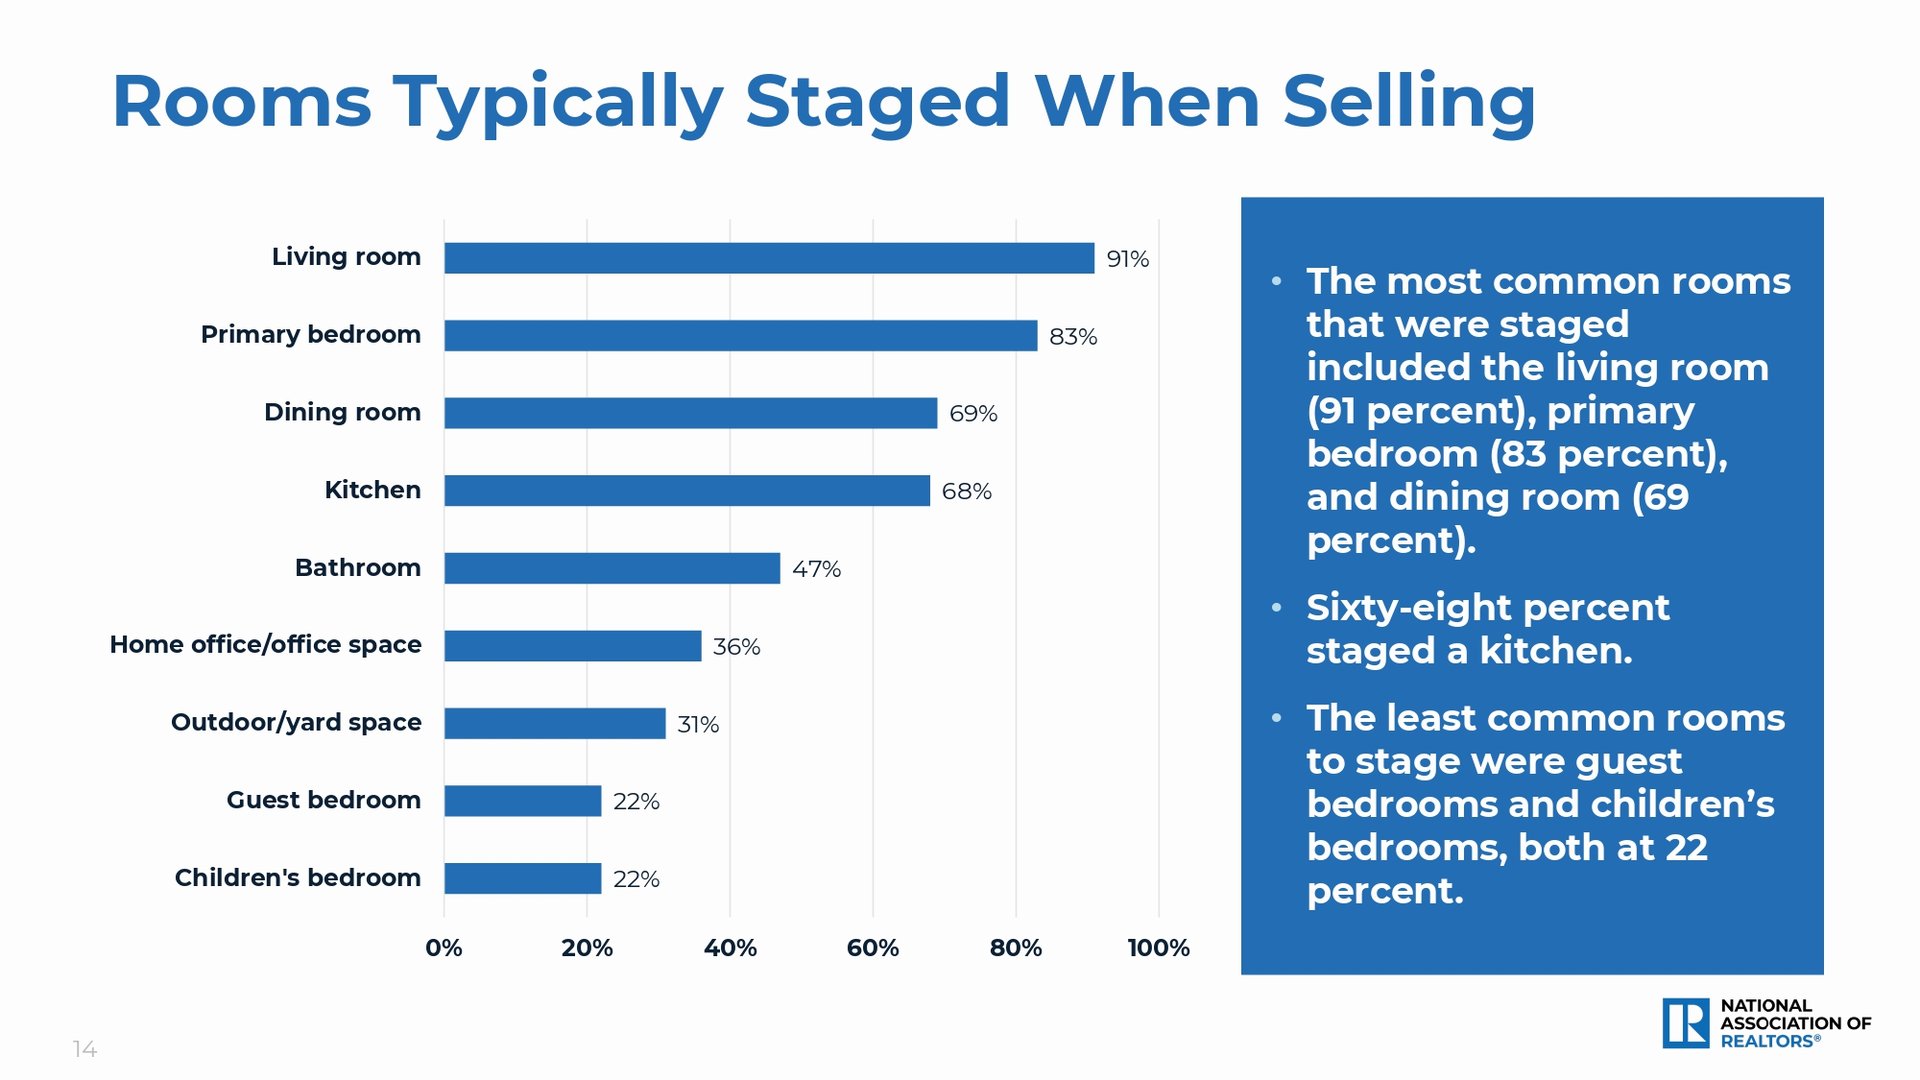
Bar chart: living rooms are staged most often (91%), followed by primary bedrooms (83%) and dining rooms (69%).

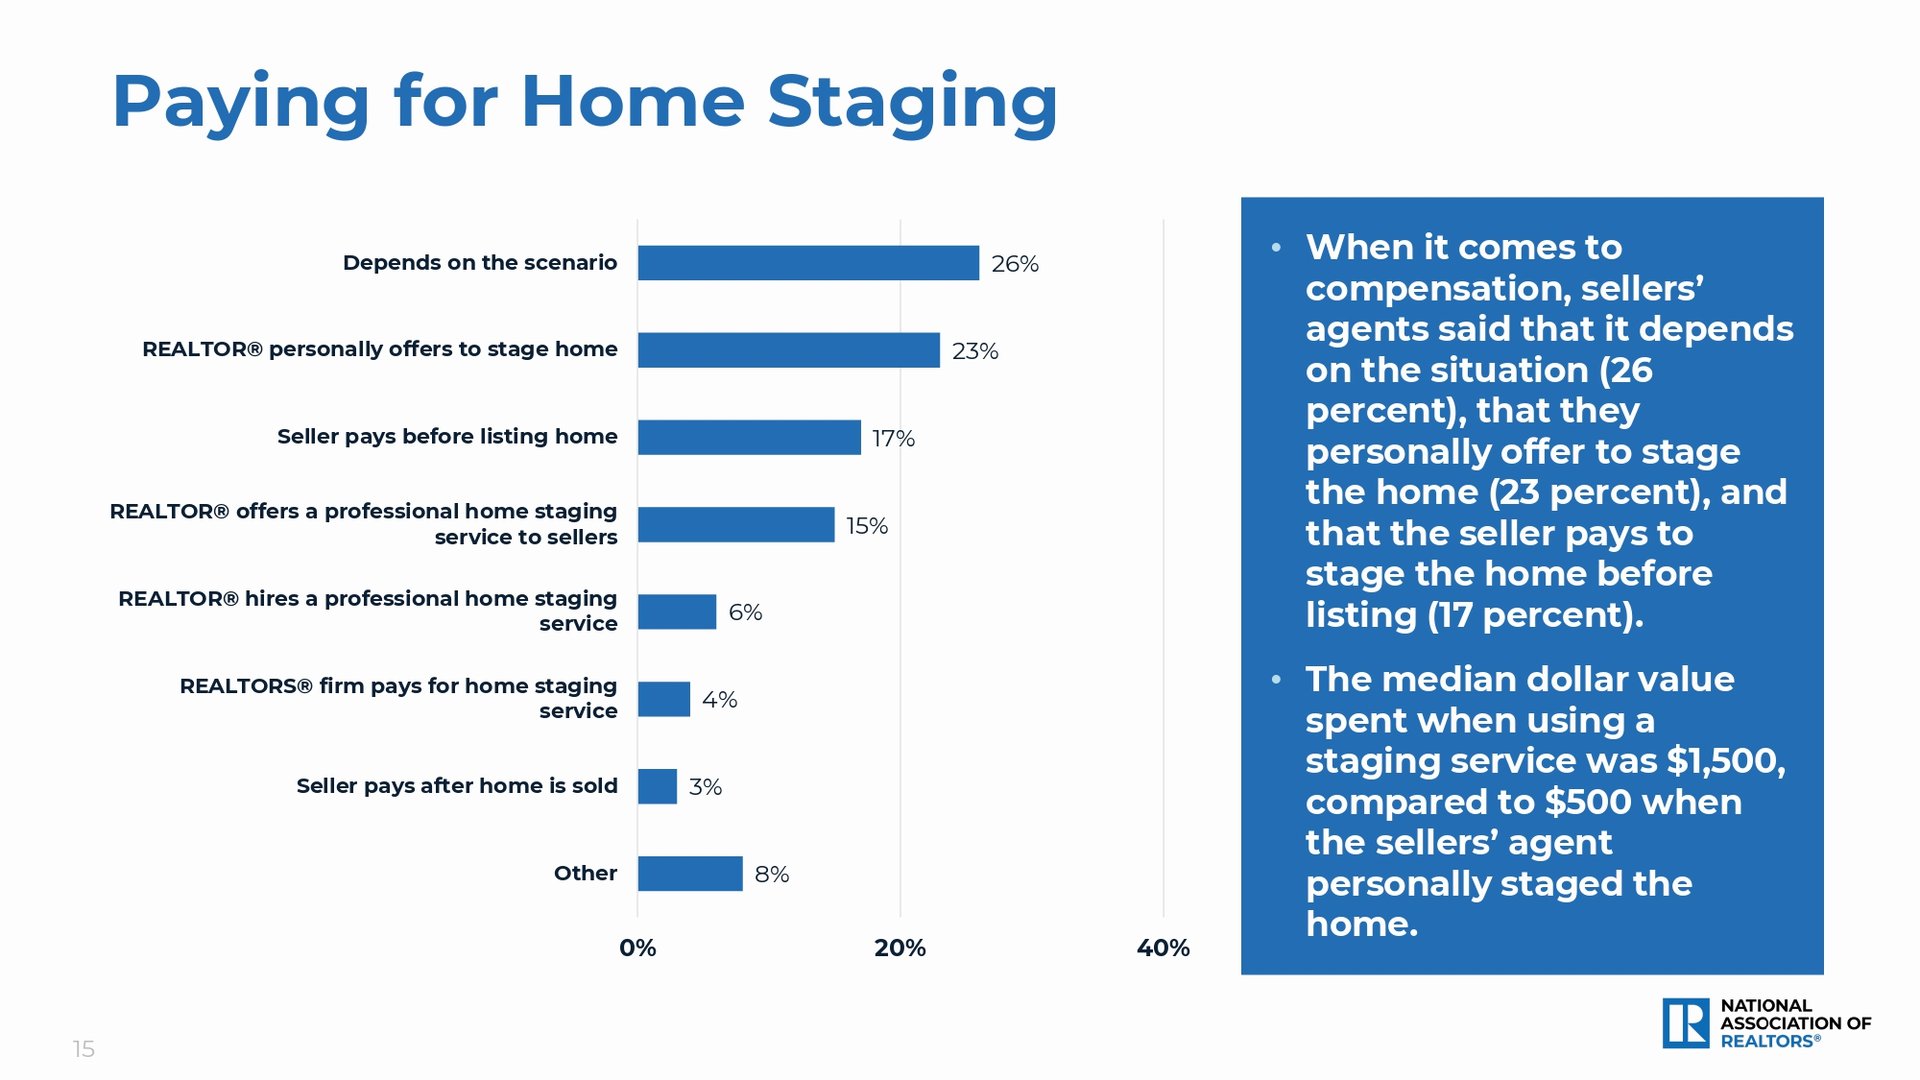
Bar chart of home staging payment arrangements; 26% say compensation depends on the scenario, and staging services cost a median $1,500.

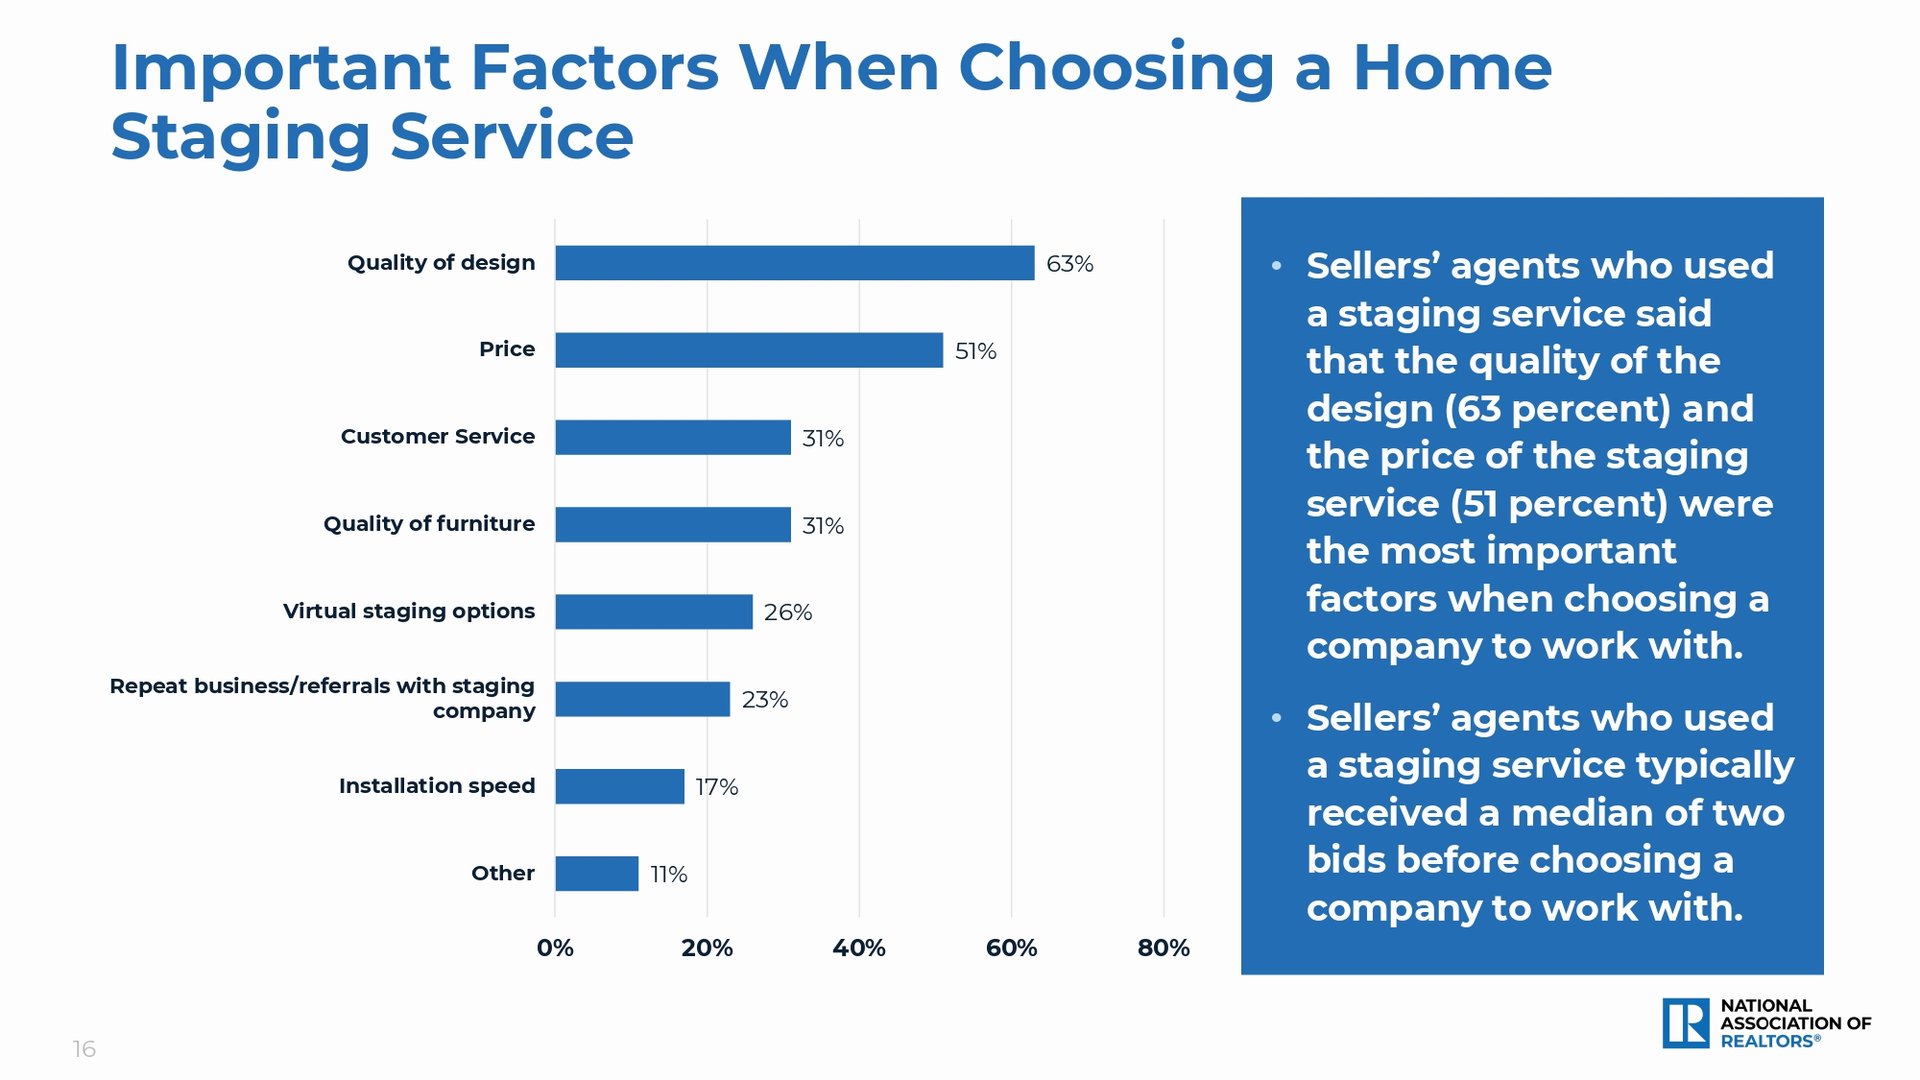
Bar chart of home staging service priorities: design quality leads at 63%, followed by price at 51%.

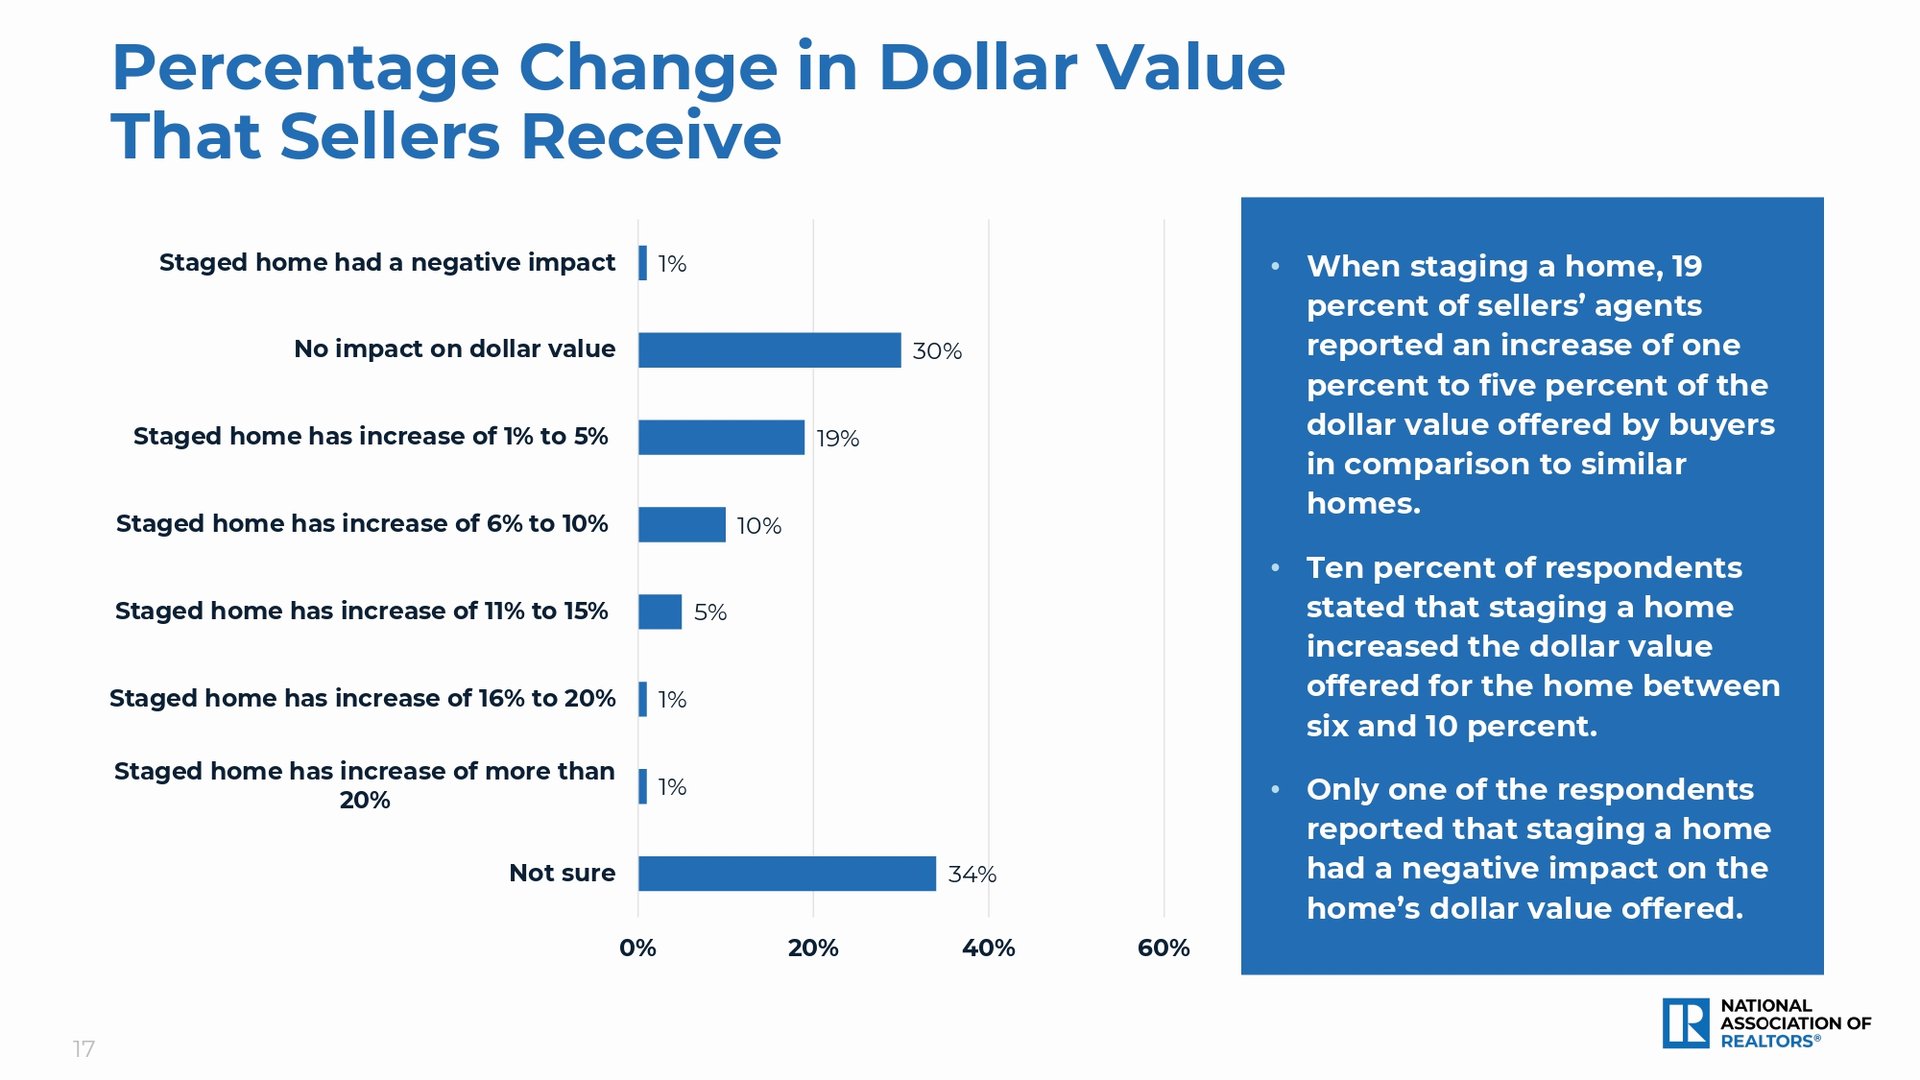
Chart of sellers’ agents’ reported changes in dollar value offered for staged homes.

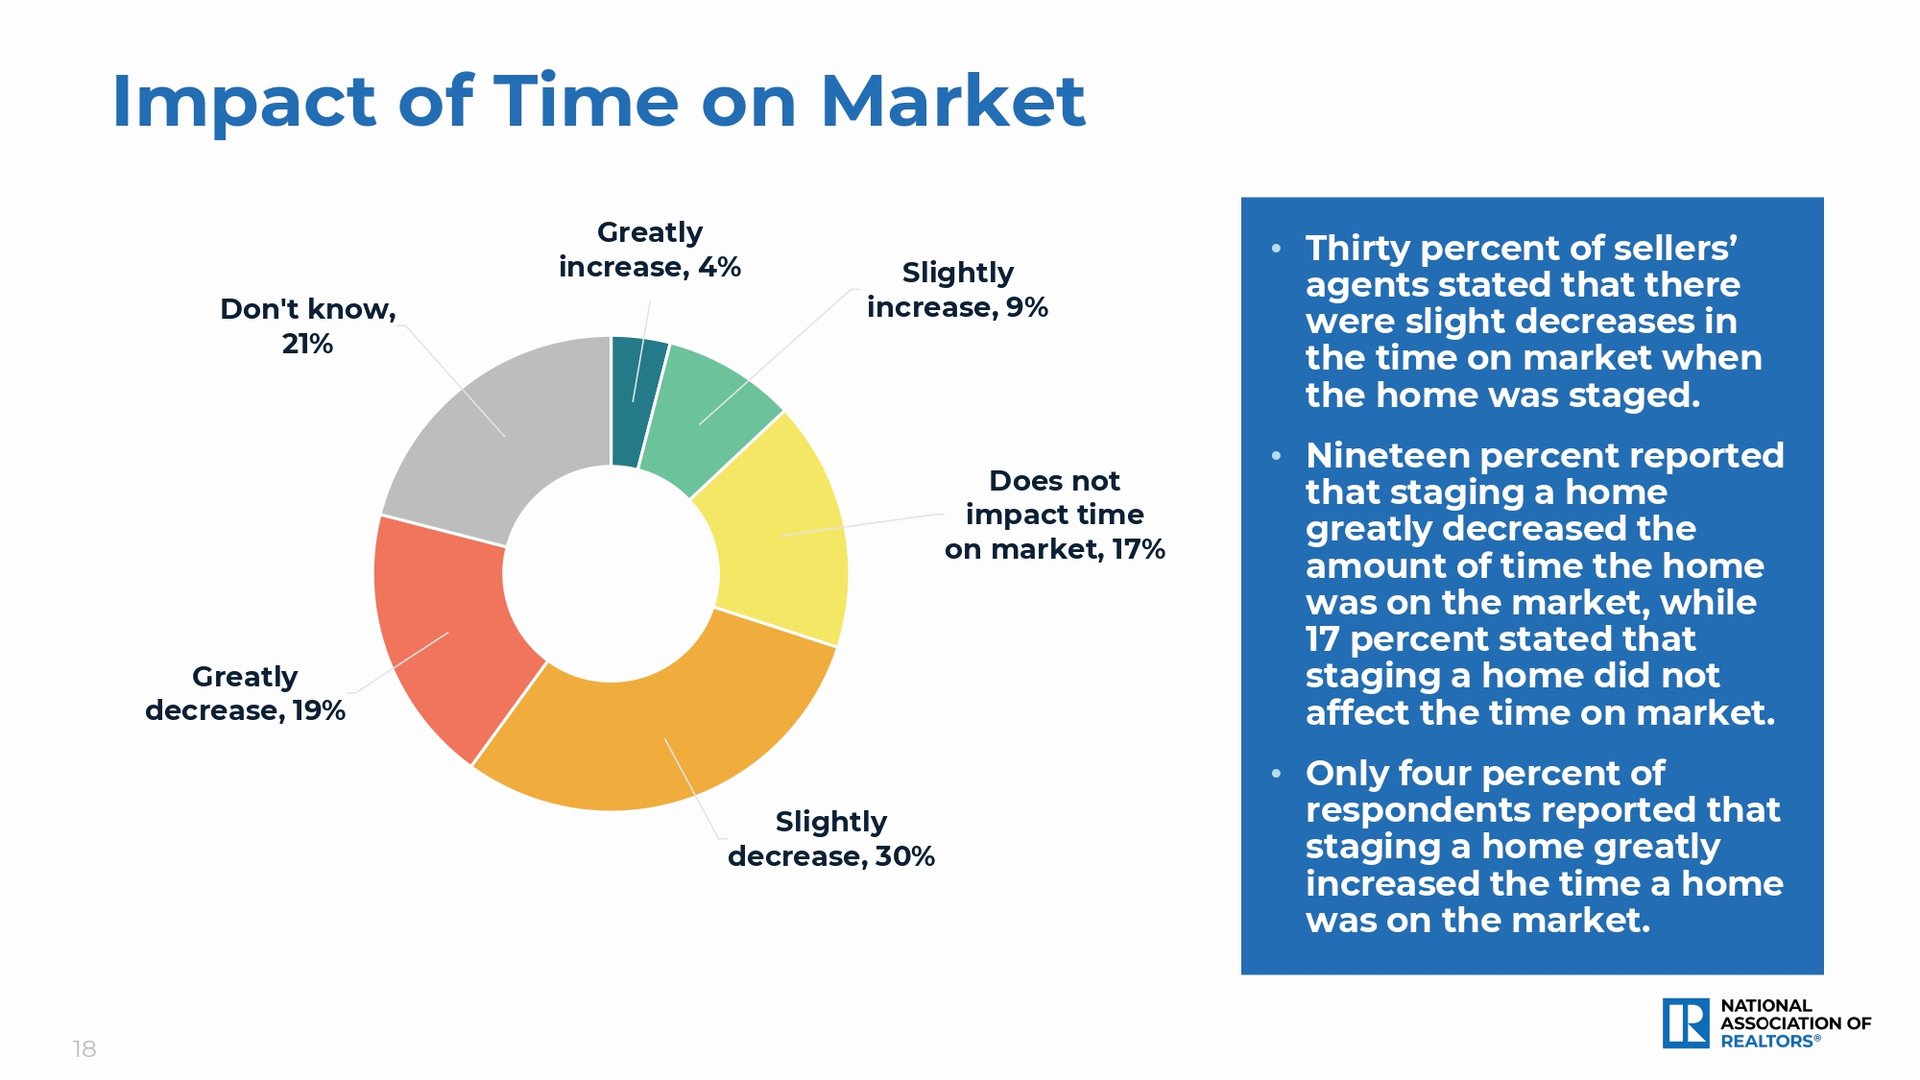
Infographic showing survey results on how home staging affects time on market; slight decrease was the most common response at 30%.

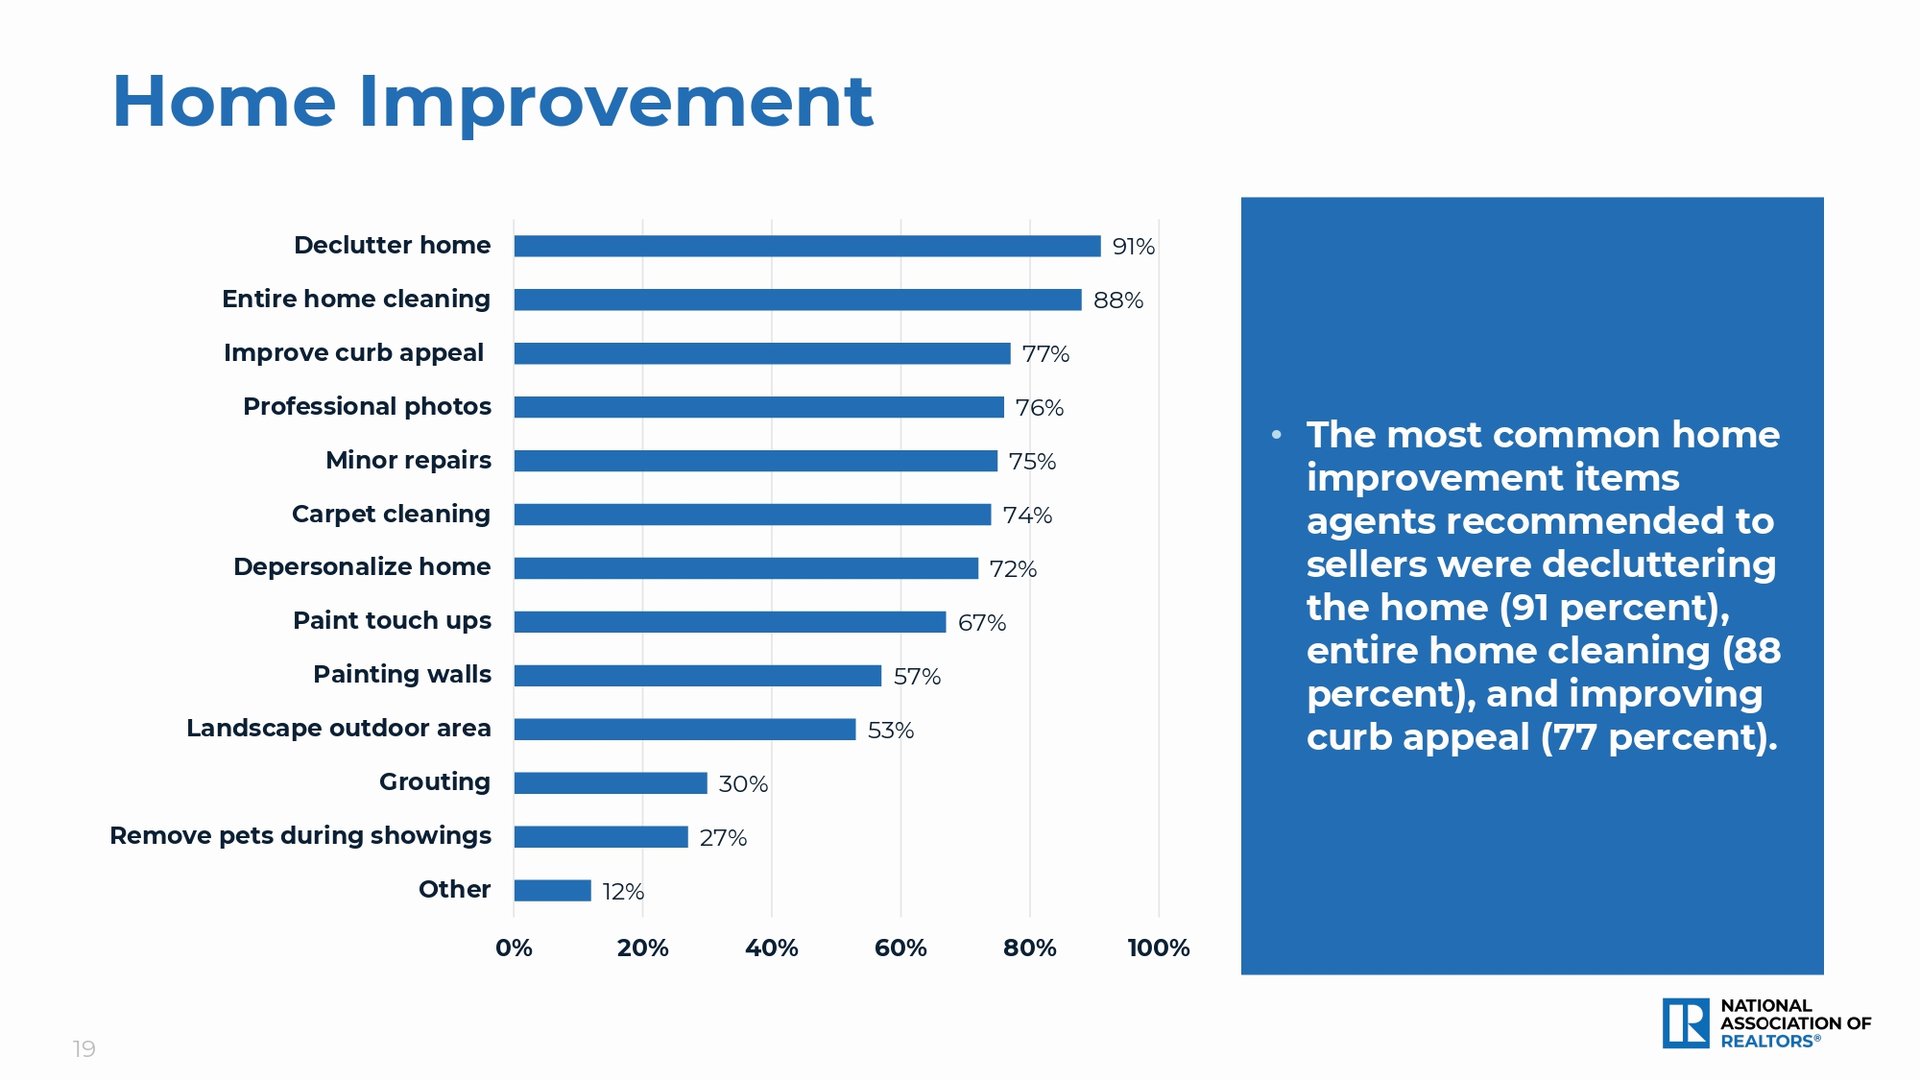
Home improvement recommendations chart, led by decluttering at 91%, cleaning at 88%, and curb appeal at 77%.

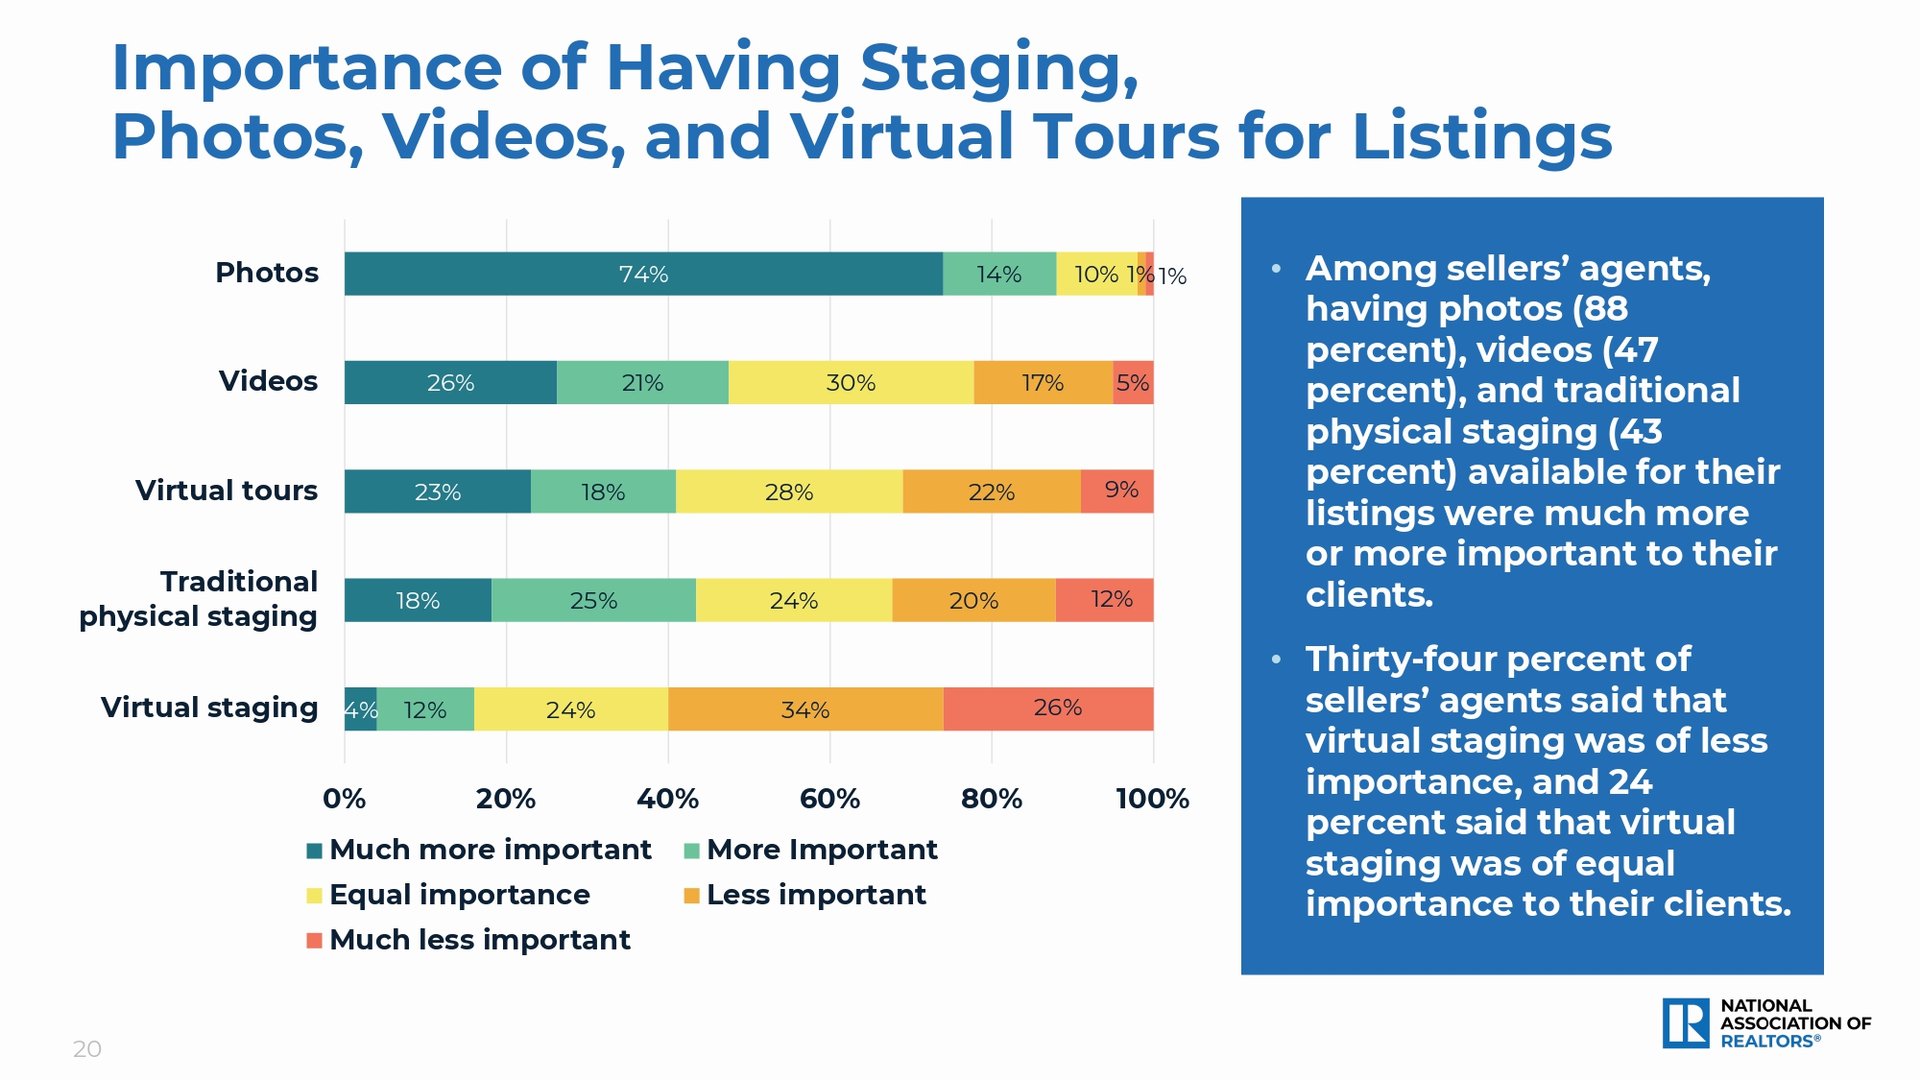
Chart comparing agents’ perceived importance of listing photos, videos, virtual tours, and staging.

Report slide titled “Section 3 | How TV Shows Influenced Buyers,” over a staged modern living room and kitchen.

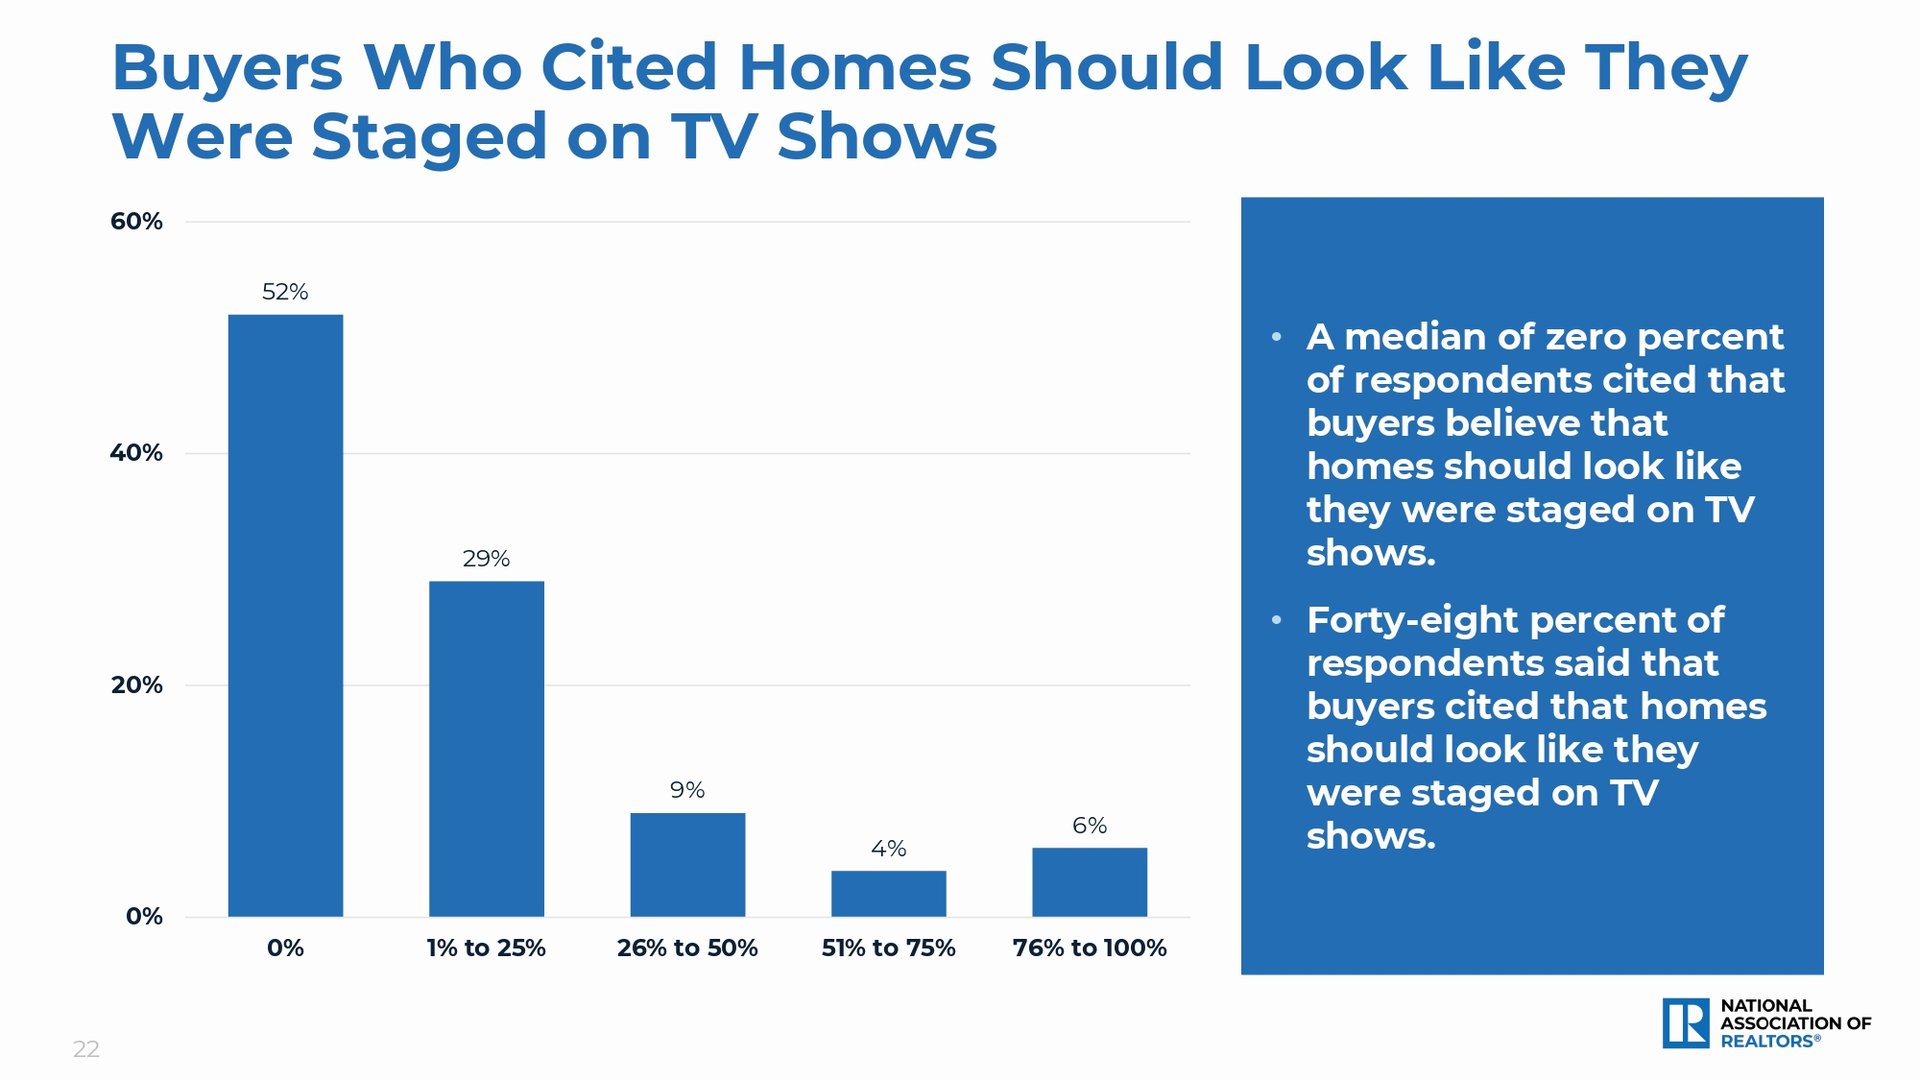
Chart of responses about homes looking TV-staged: 52% selected 0%, while 29%, 9%, 4%, and 6% selected higher ranges.

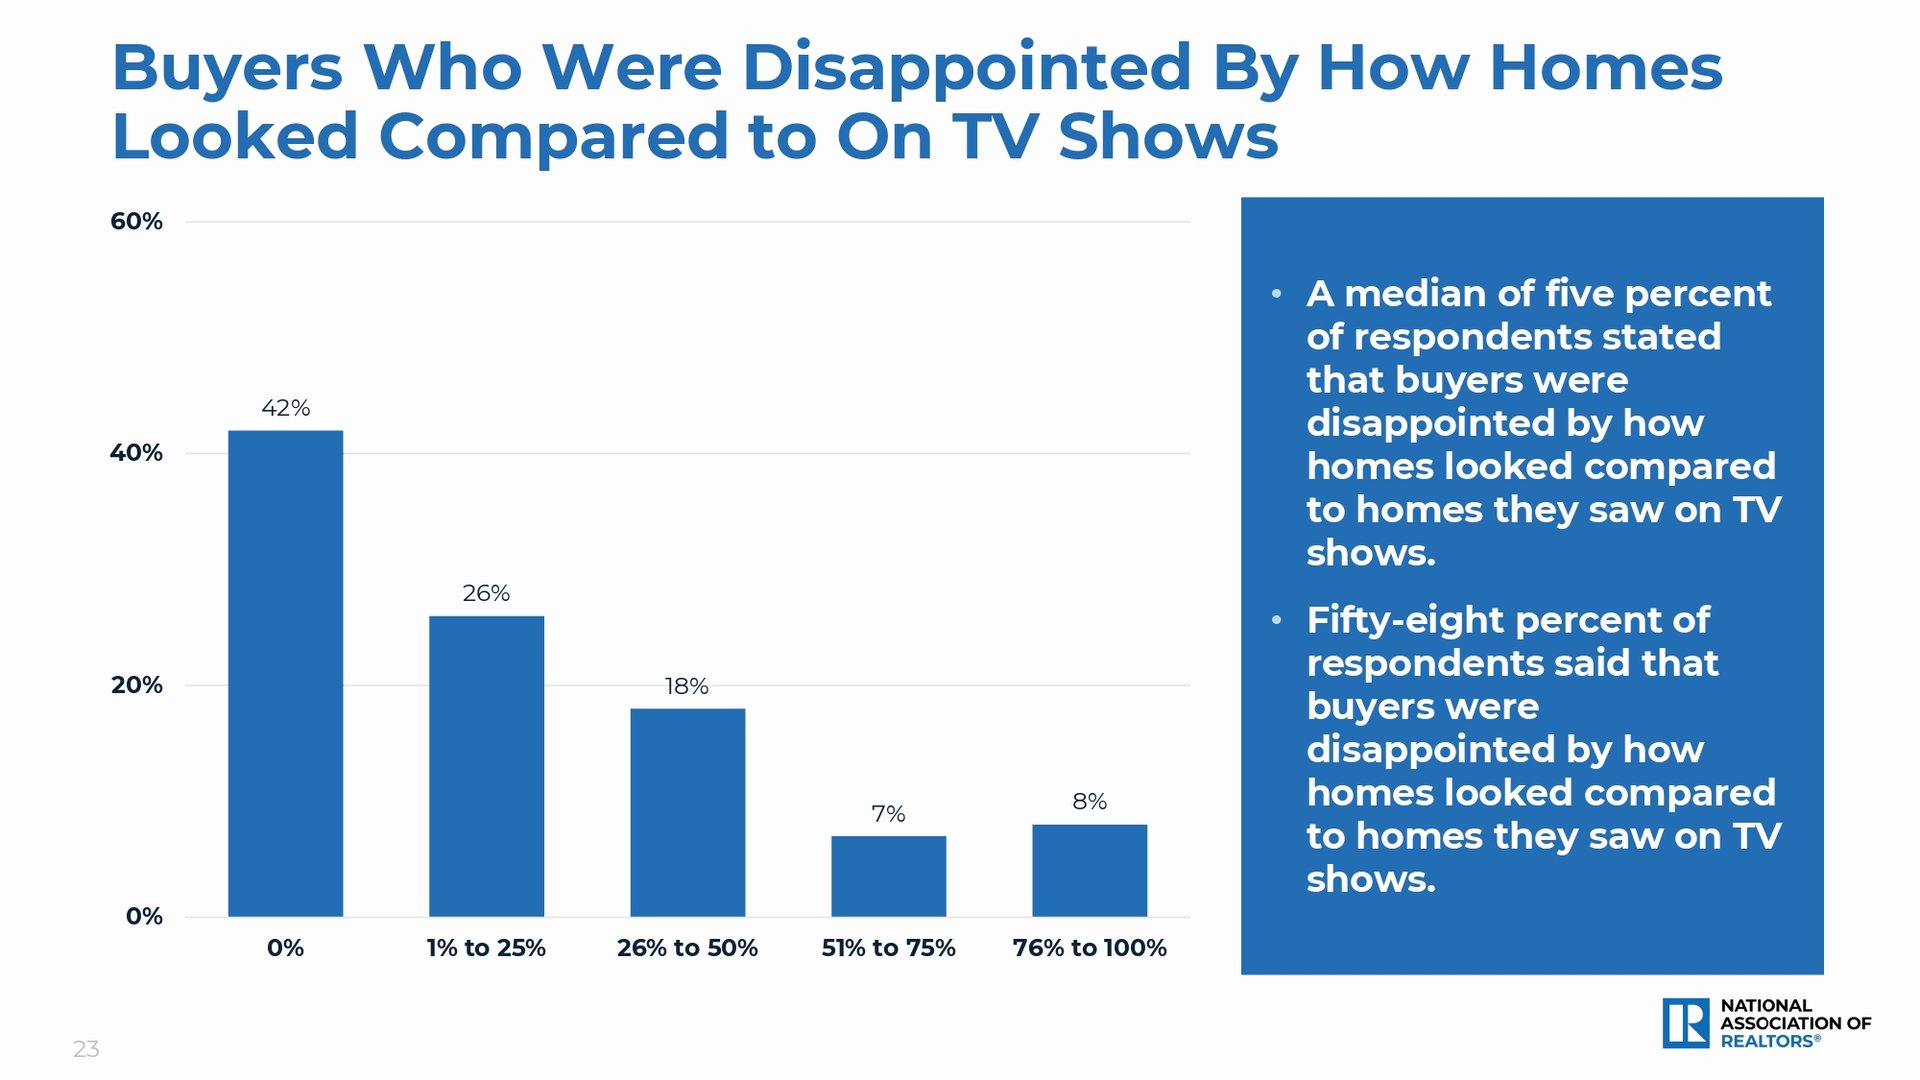
Chart of buyer disappointment compared with TV homes: 42% reported 0%, 26% 1–25%, 18% 26–50%, 7% 51–75%, and 8% 76–100%.

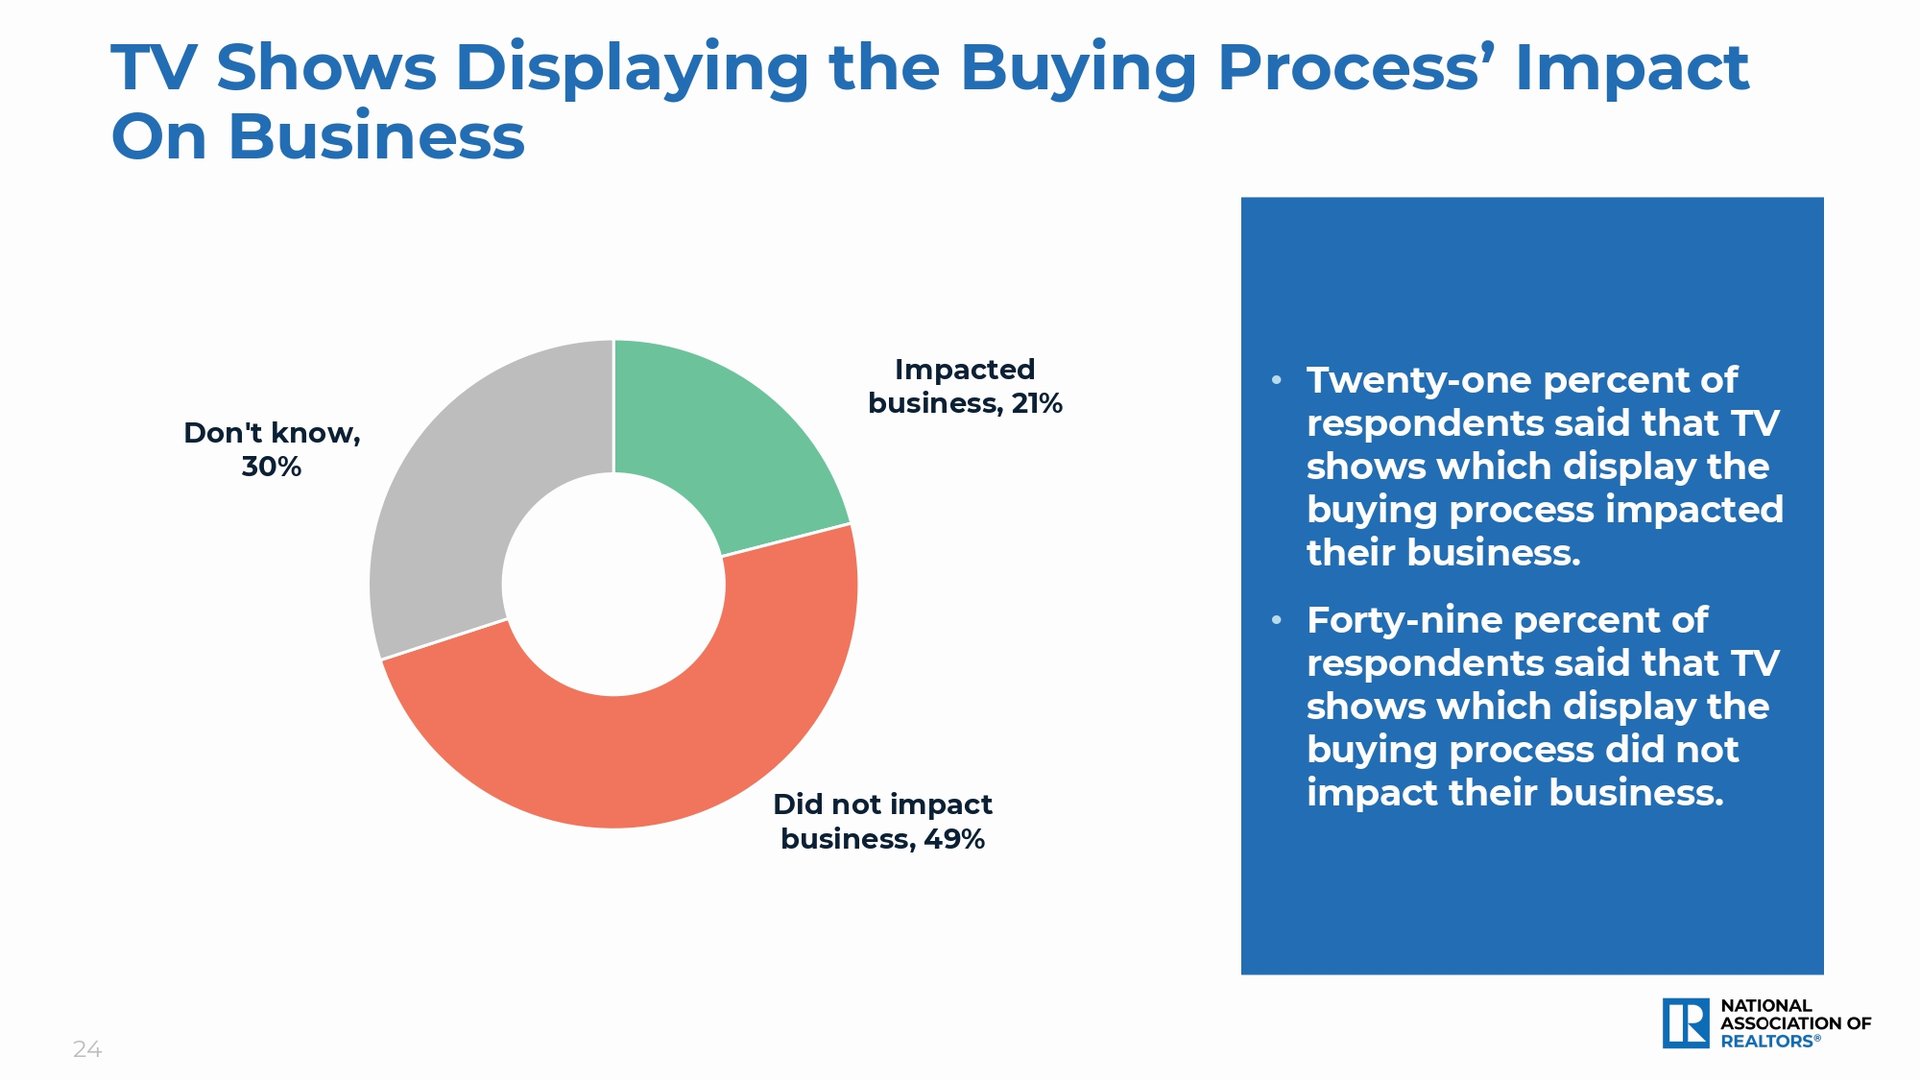
Donut chart shows business impact responses: 21% impacted, 49% not impacted, and 30% don't know.

Section 4 | Buyer Expectations, over a styled neutral bedroom.

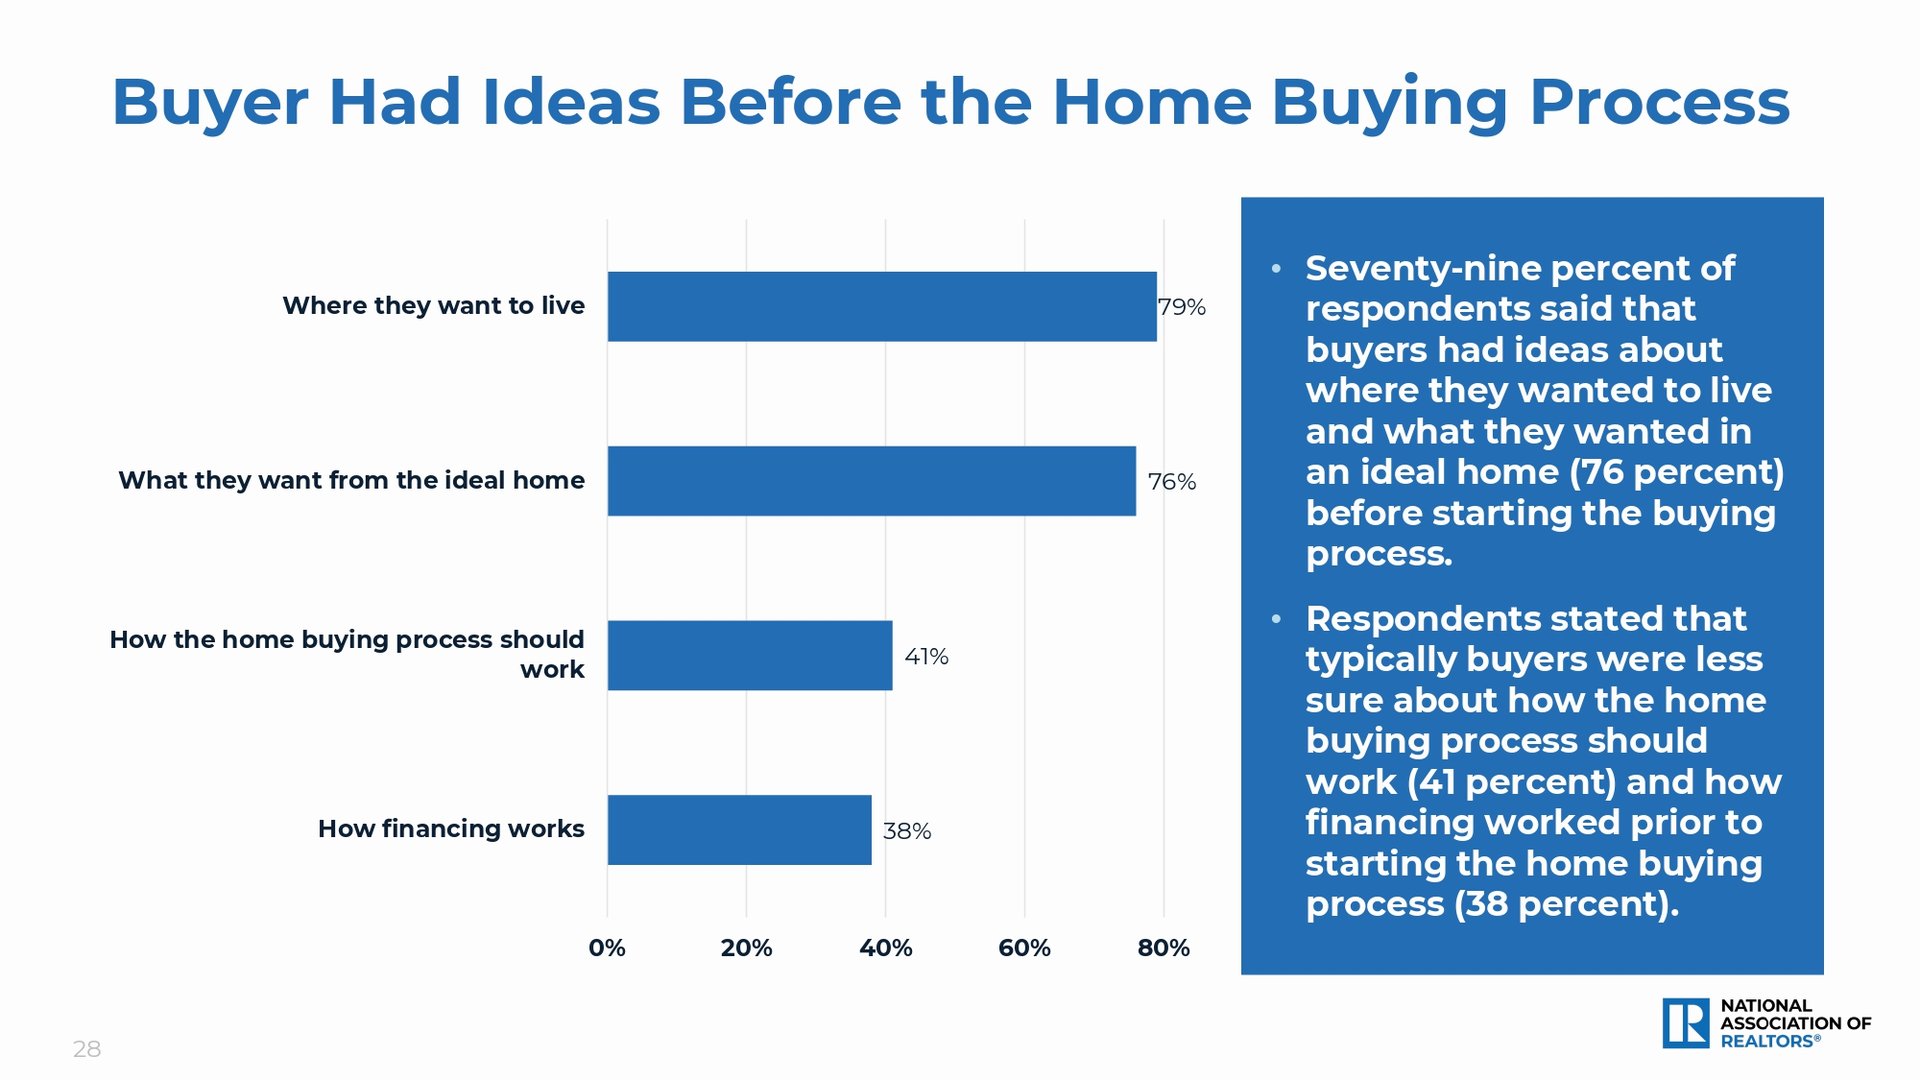
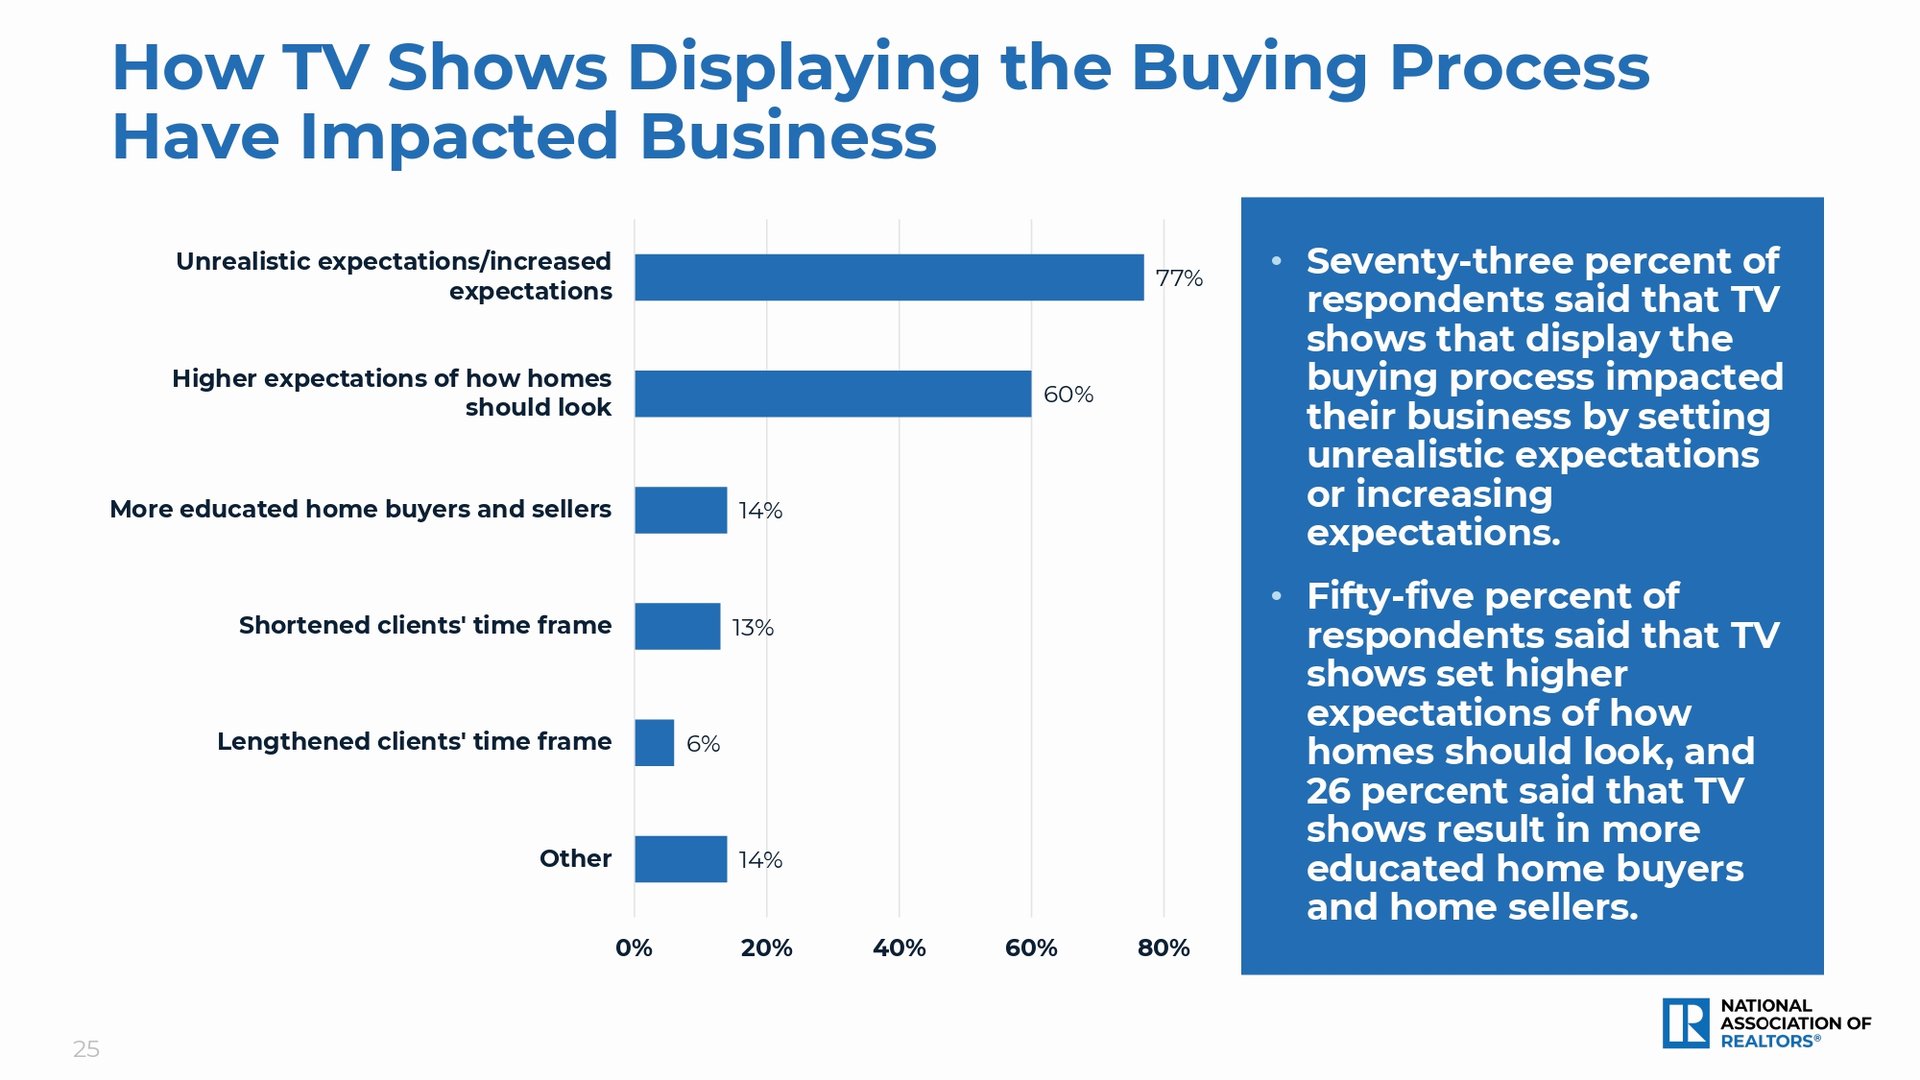
Chart shows buyers’ prior ideas about where to live (79%) and ideal homes (76%), versus buying process (41%) and financing (38%).Bar chart showing TV home-buying shows’ reported business impacts, led by unrealistic expectations at 77%.

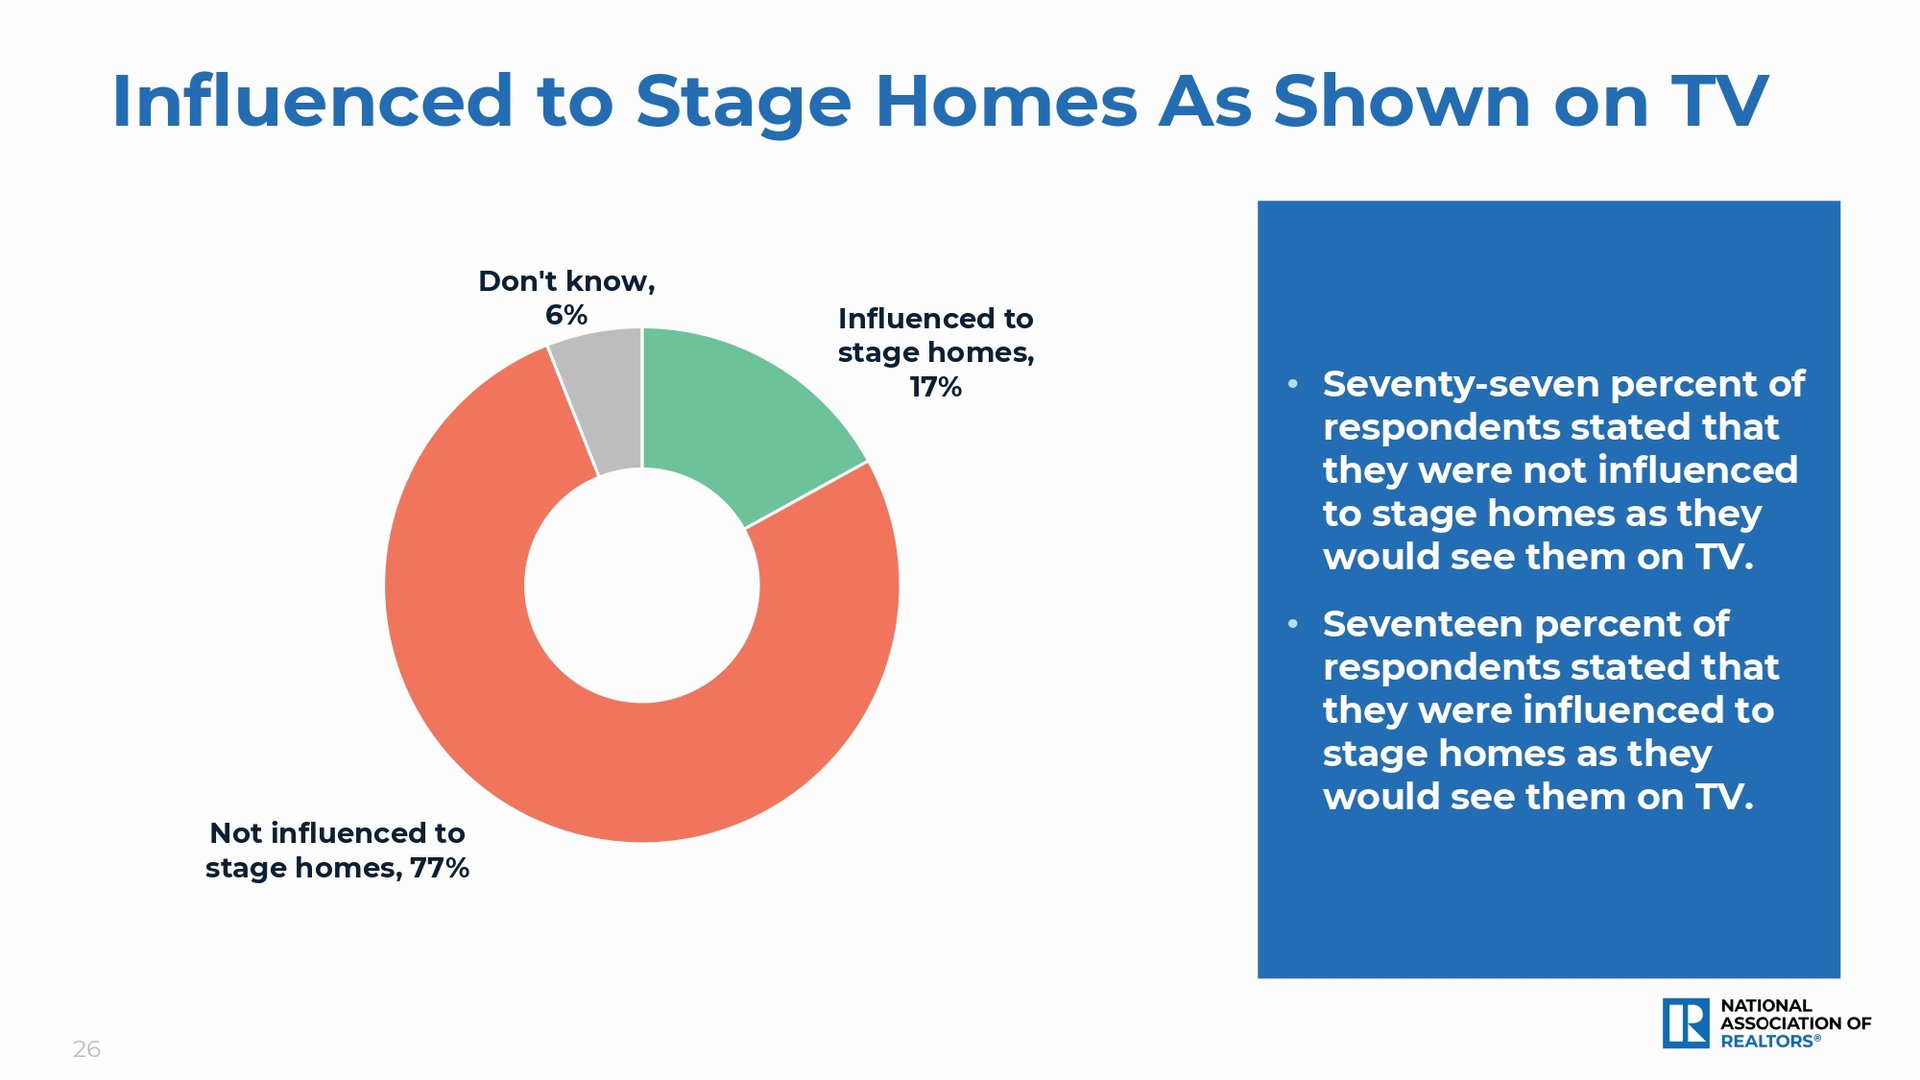
Donut chart showing 77% not influenced by TV staging, 17% influenced, and 6% unsure.


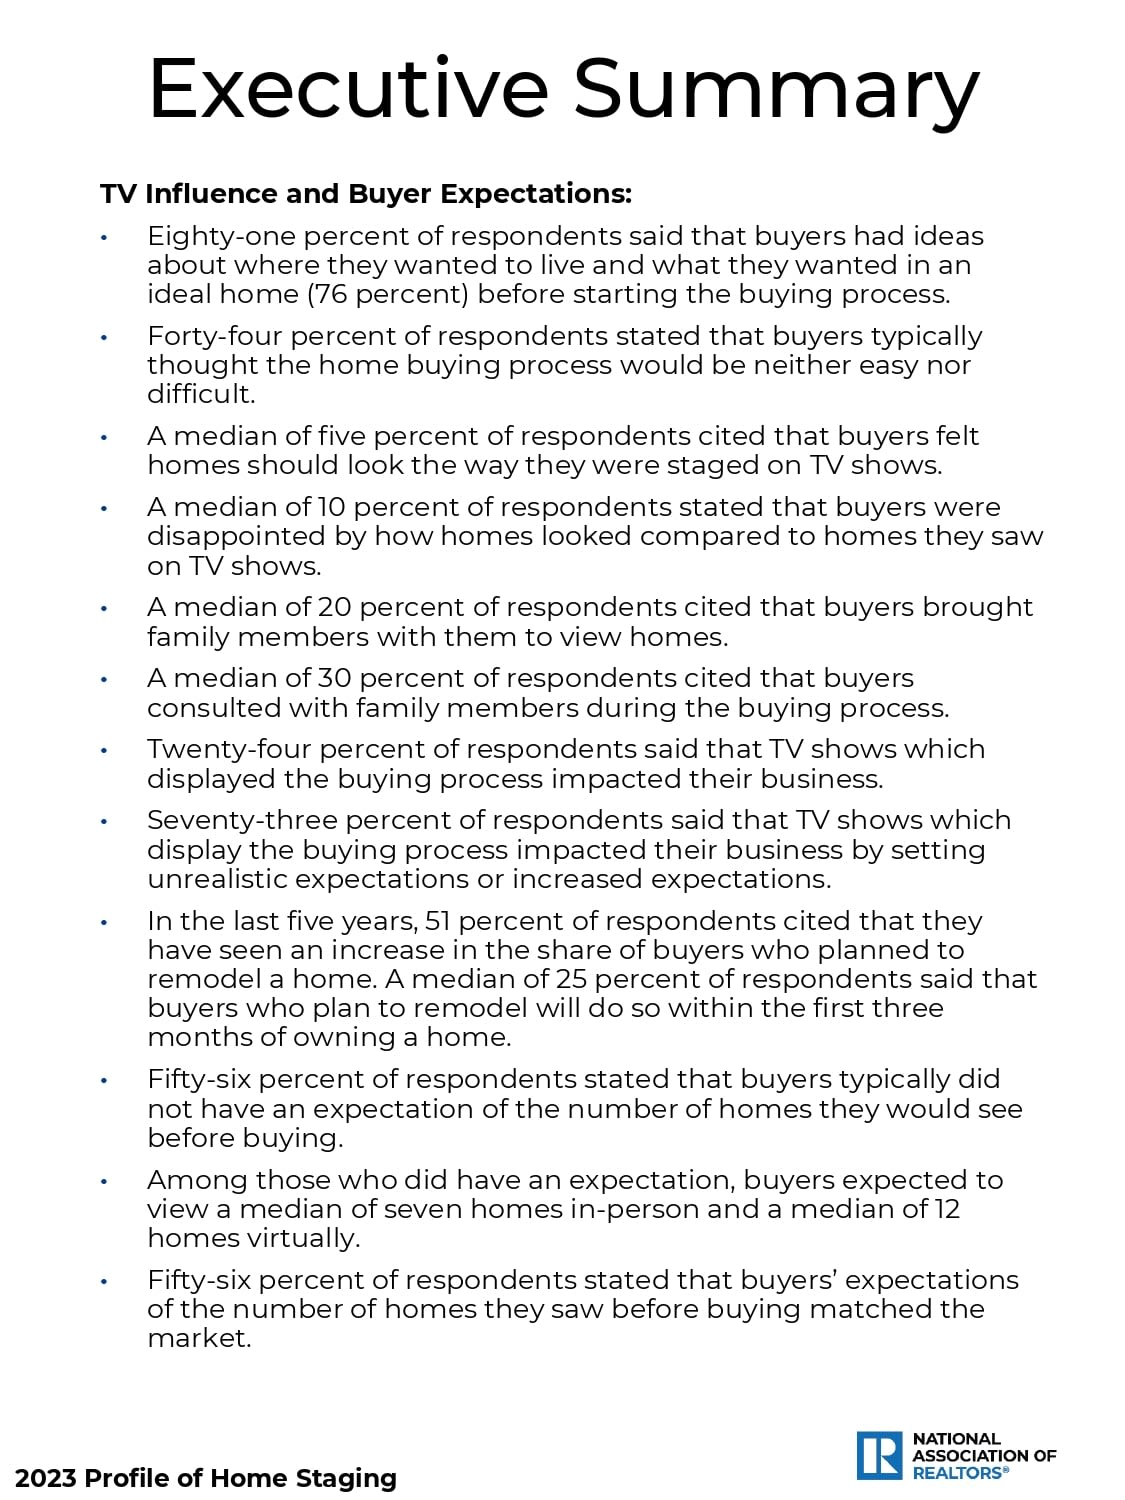
Executive summary of survey findings on home staging, television influence, and home buyer expectations.

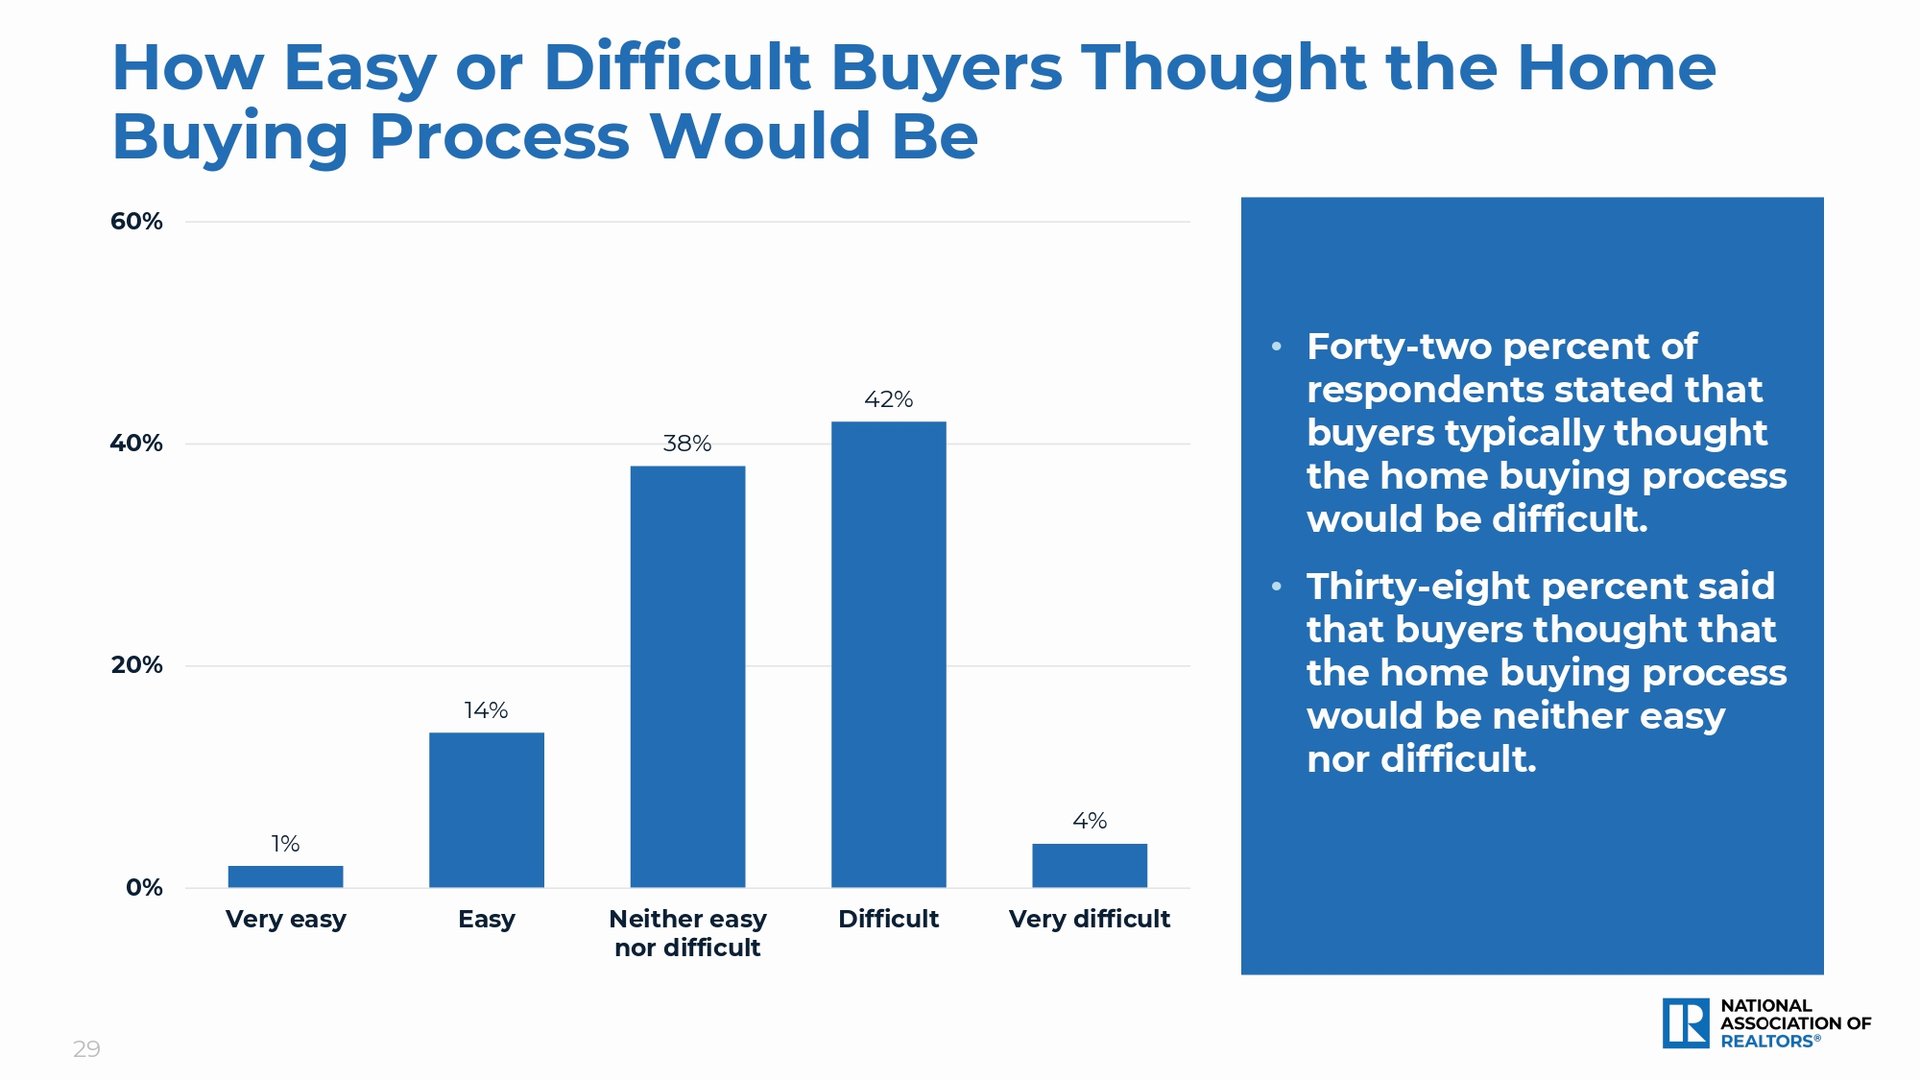
Survey chart: 42% thought buying a home would be difficult, 38% neither easy nor difficult, and 14% easy.
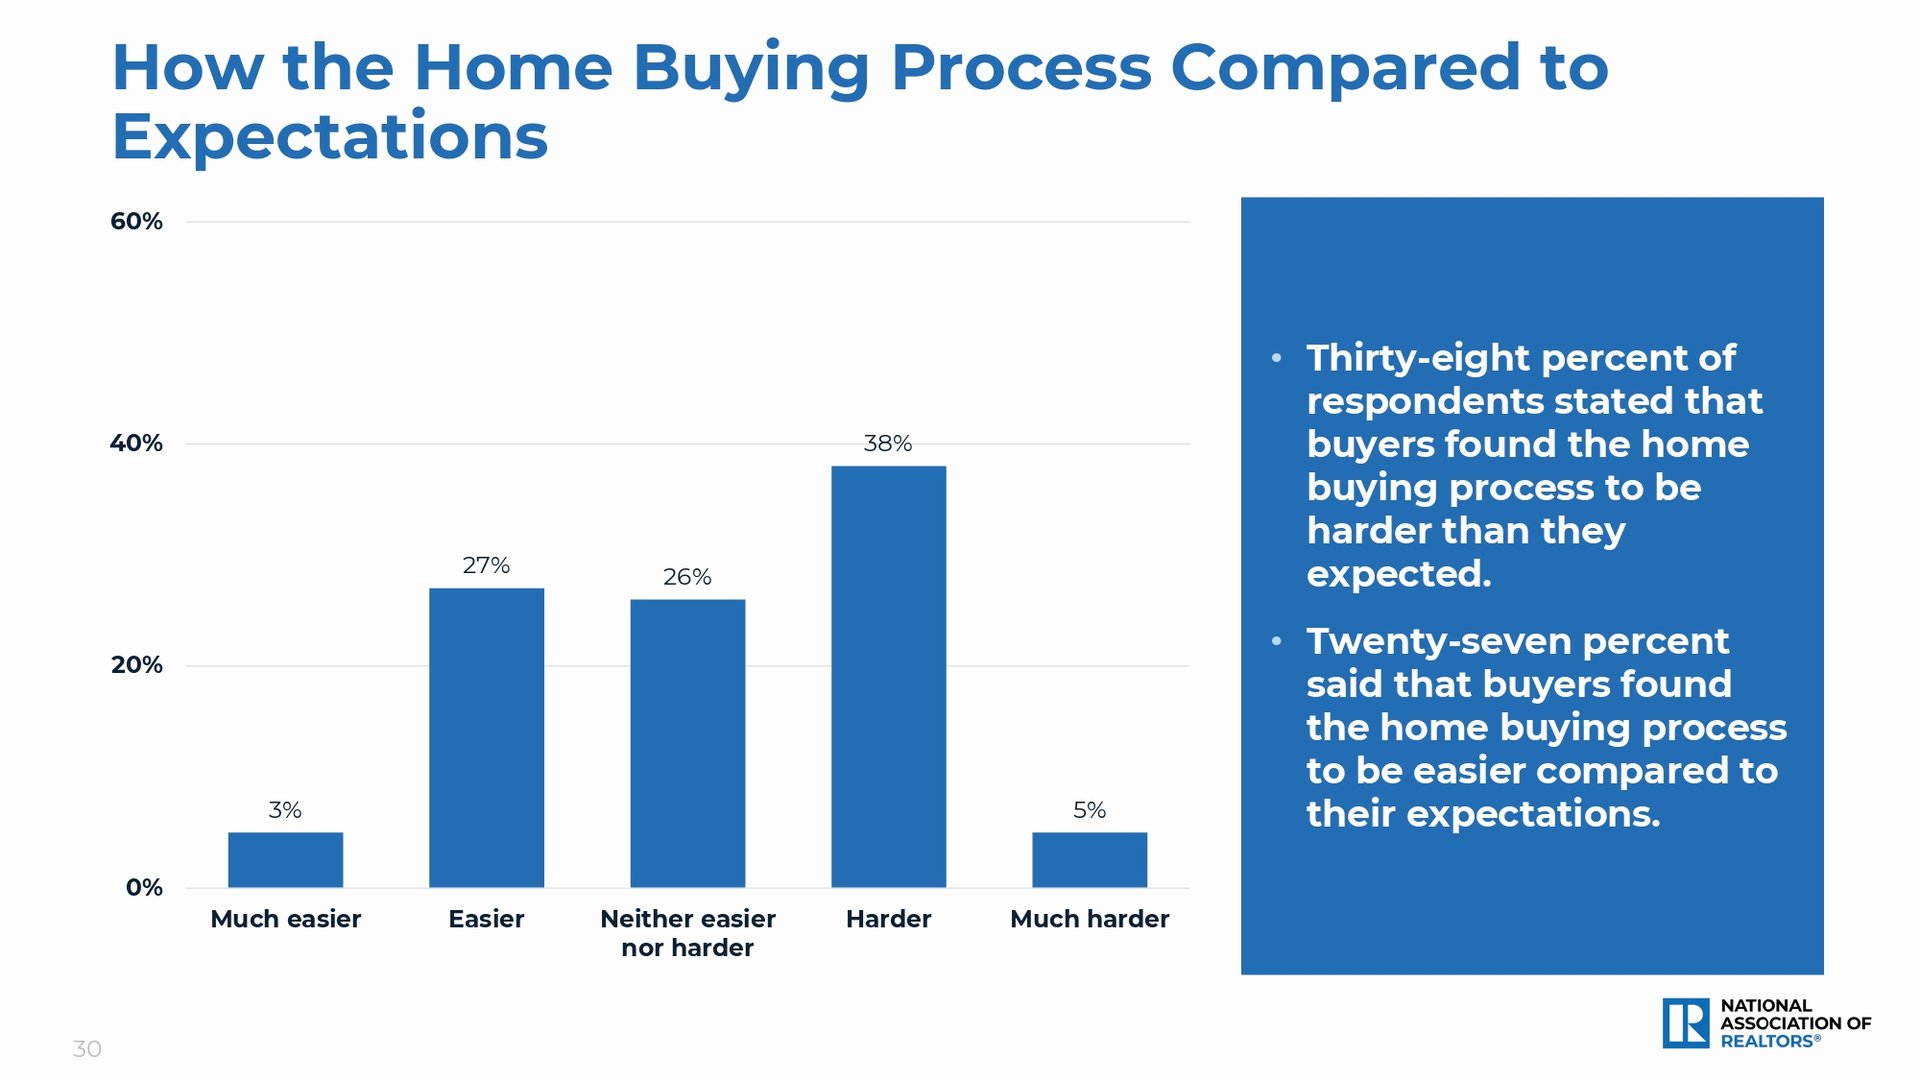
Chart: 38% found home buying harder than expected; 27% easier, 26% neither, 3% much easier, and 5% much harder.
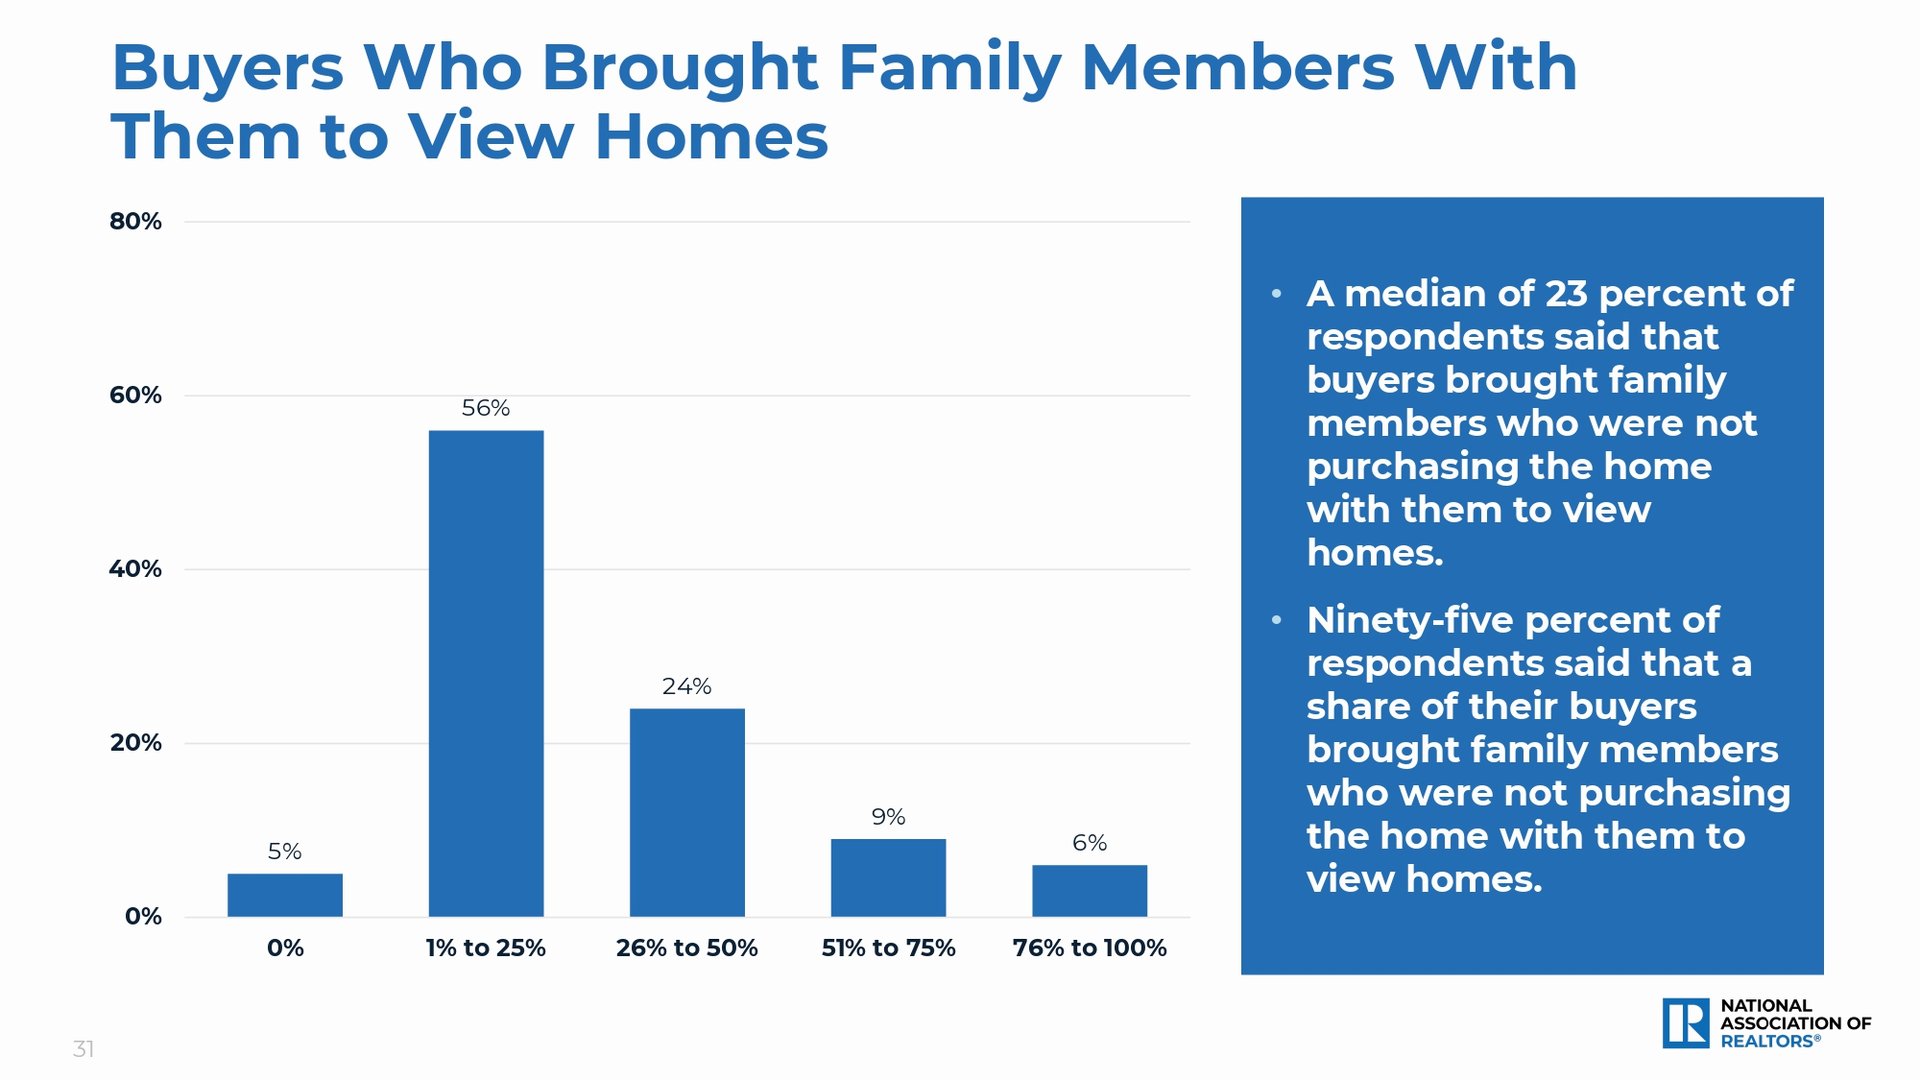
Chart showing how often buyers brought non-purchasing family members to view homes, with 56% reporting 1% to 25%.

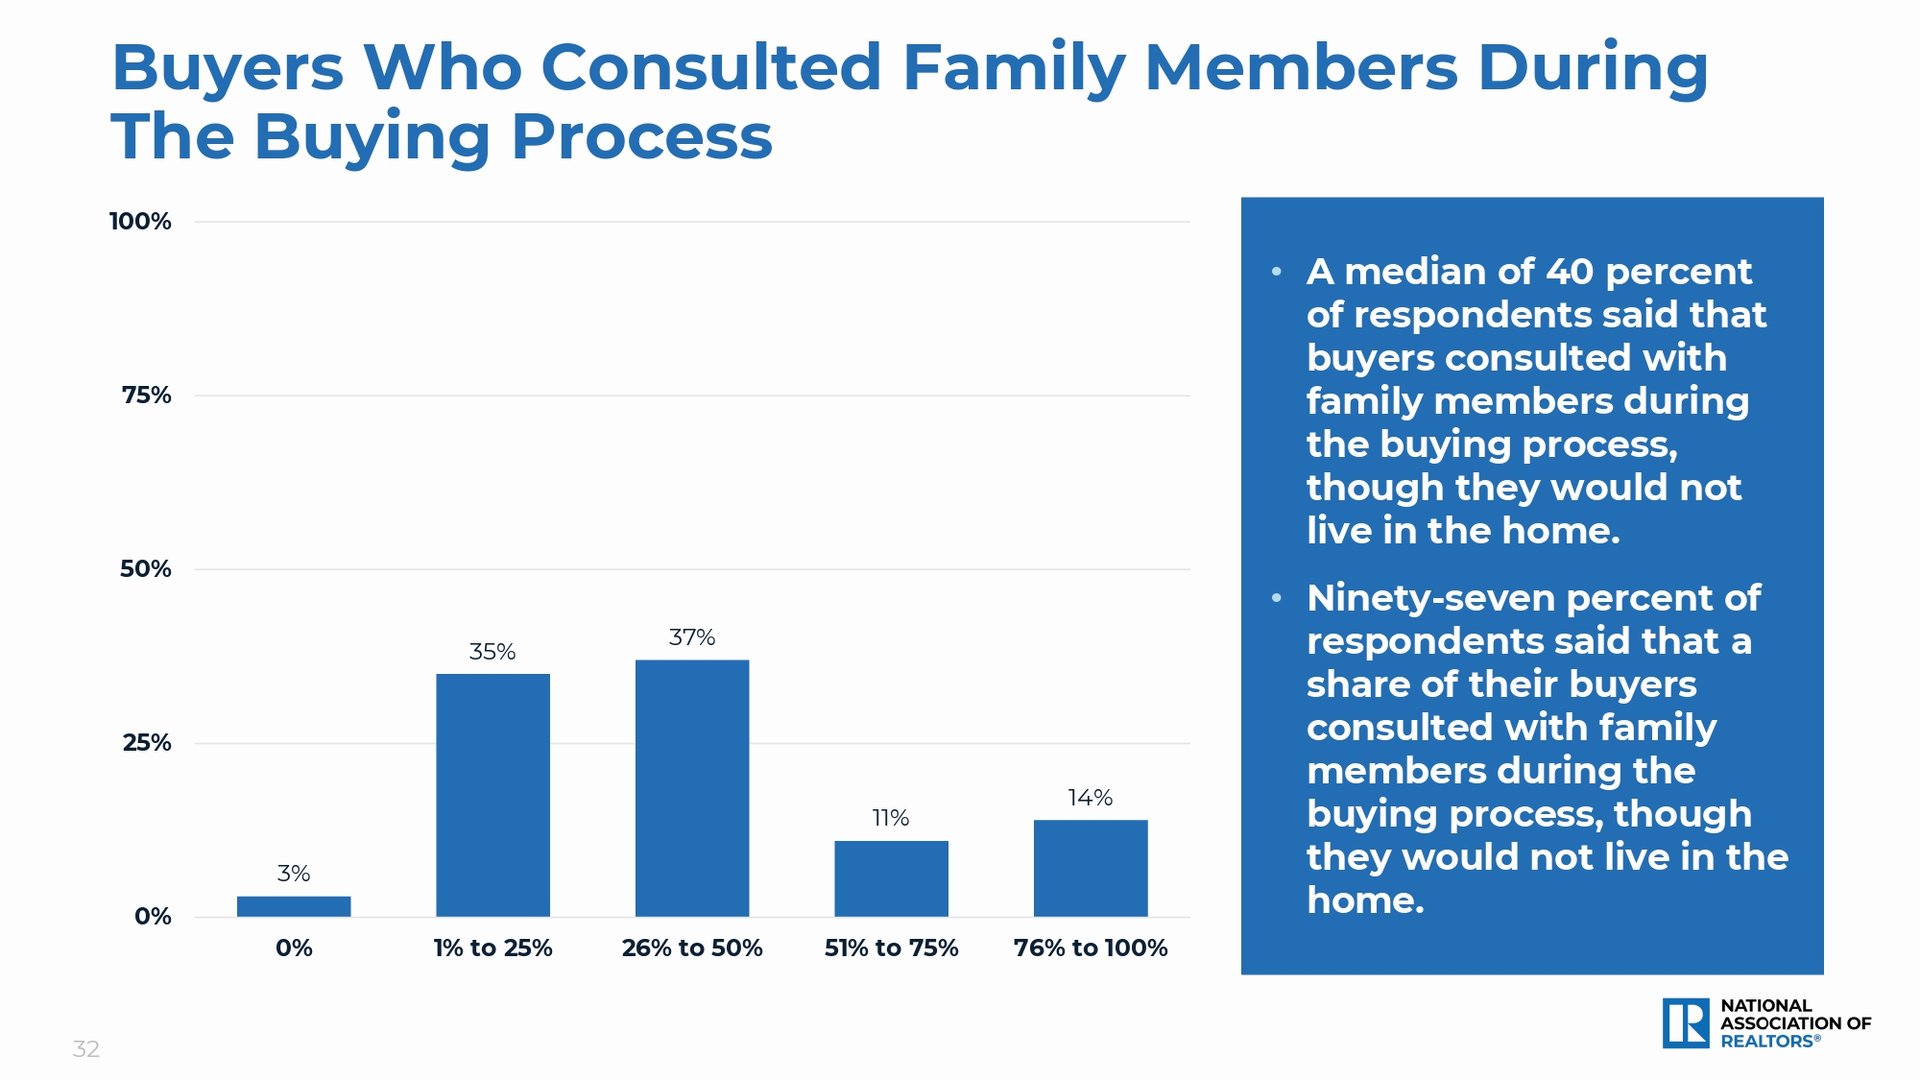
Bar chart of buyers consulting family: 3%, 35%, 37%, 11%, and 14% across five ranges.

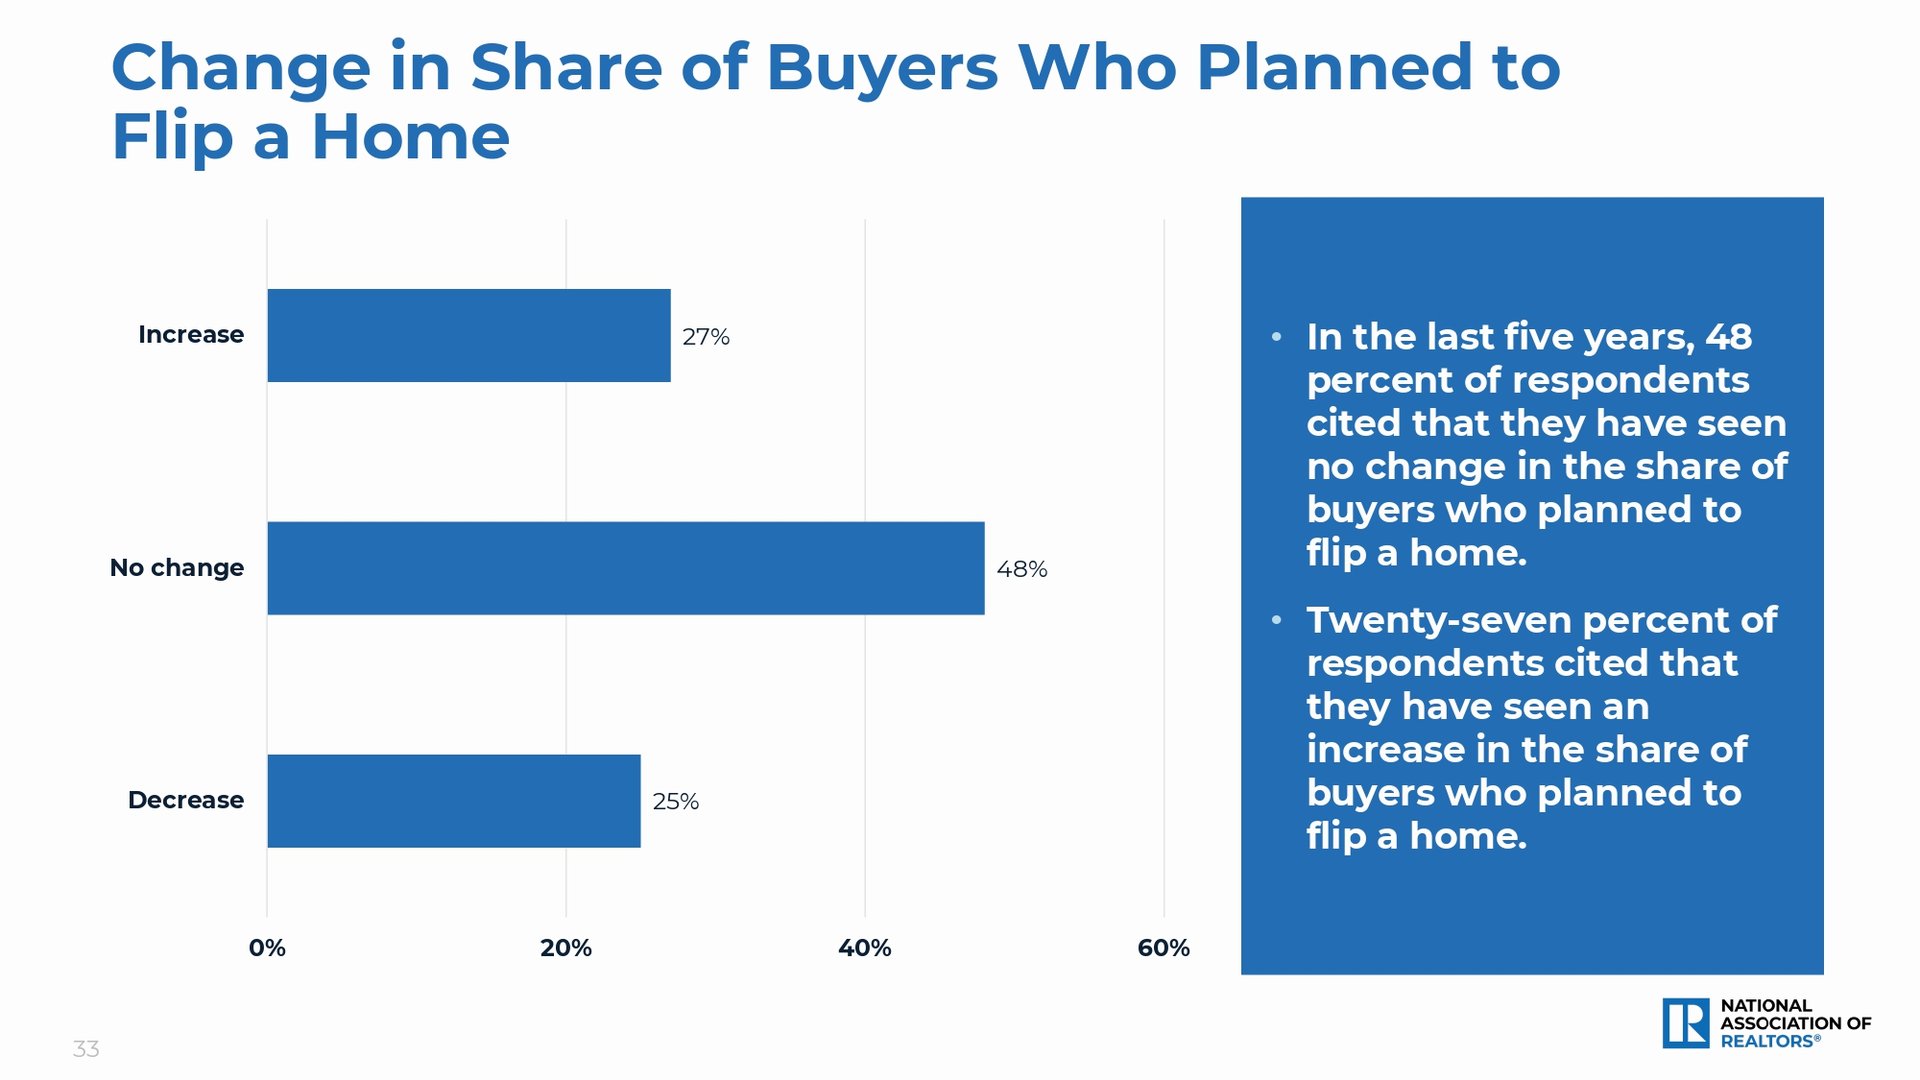
Chart: 48% saw no change, 27% saw an increase, and 25% saw a decrease in buyers planning to flip a home.

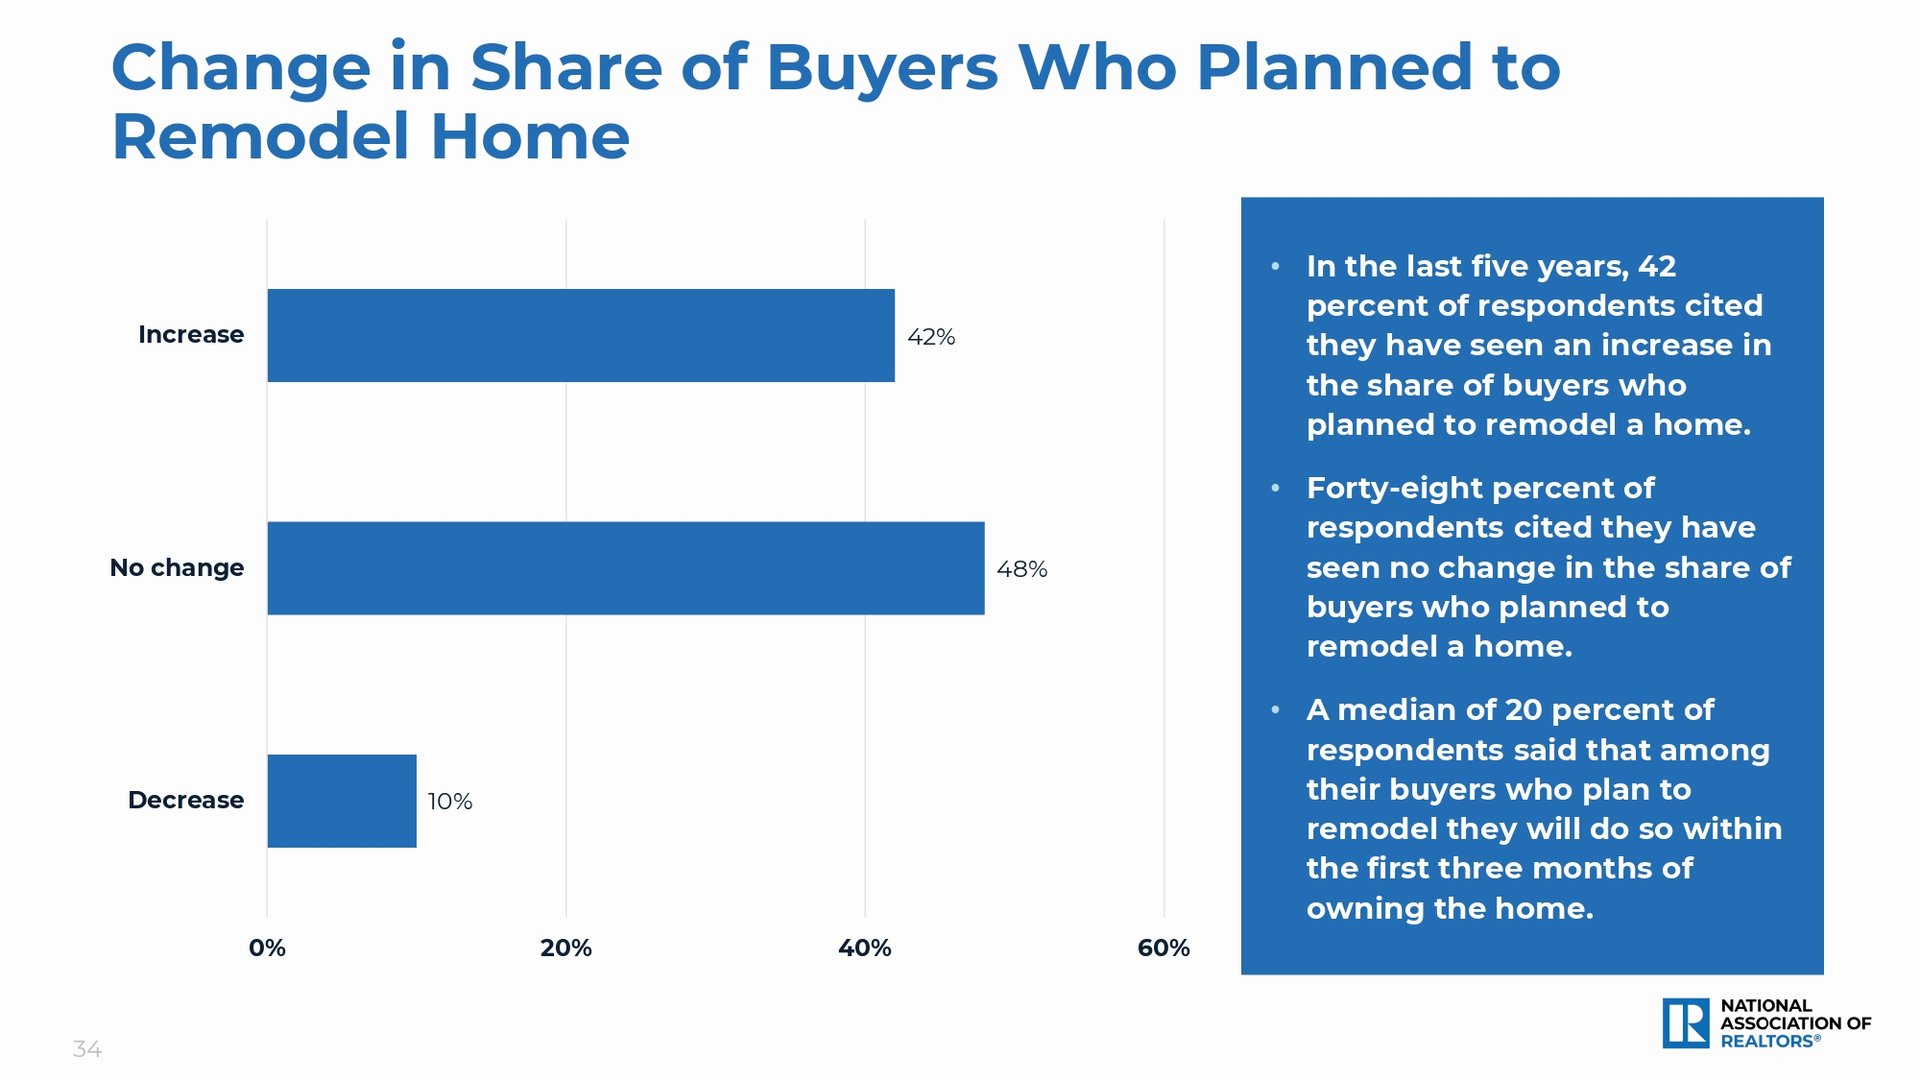
Chart showing 48% reported no change, 42% an increase, and 10% a decrease in planned home remodeling.

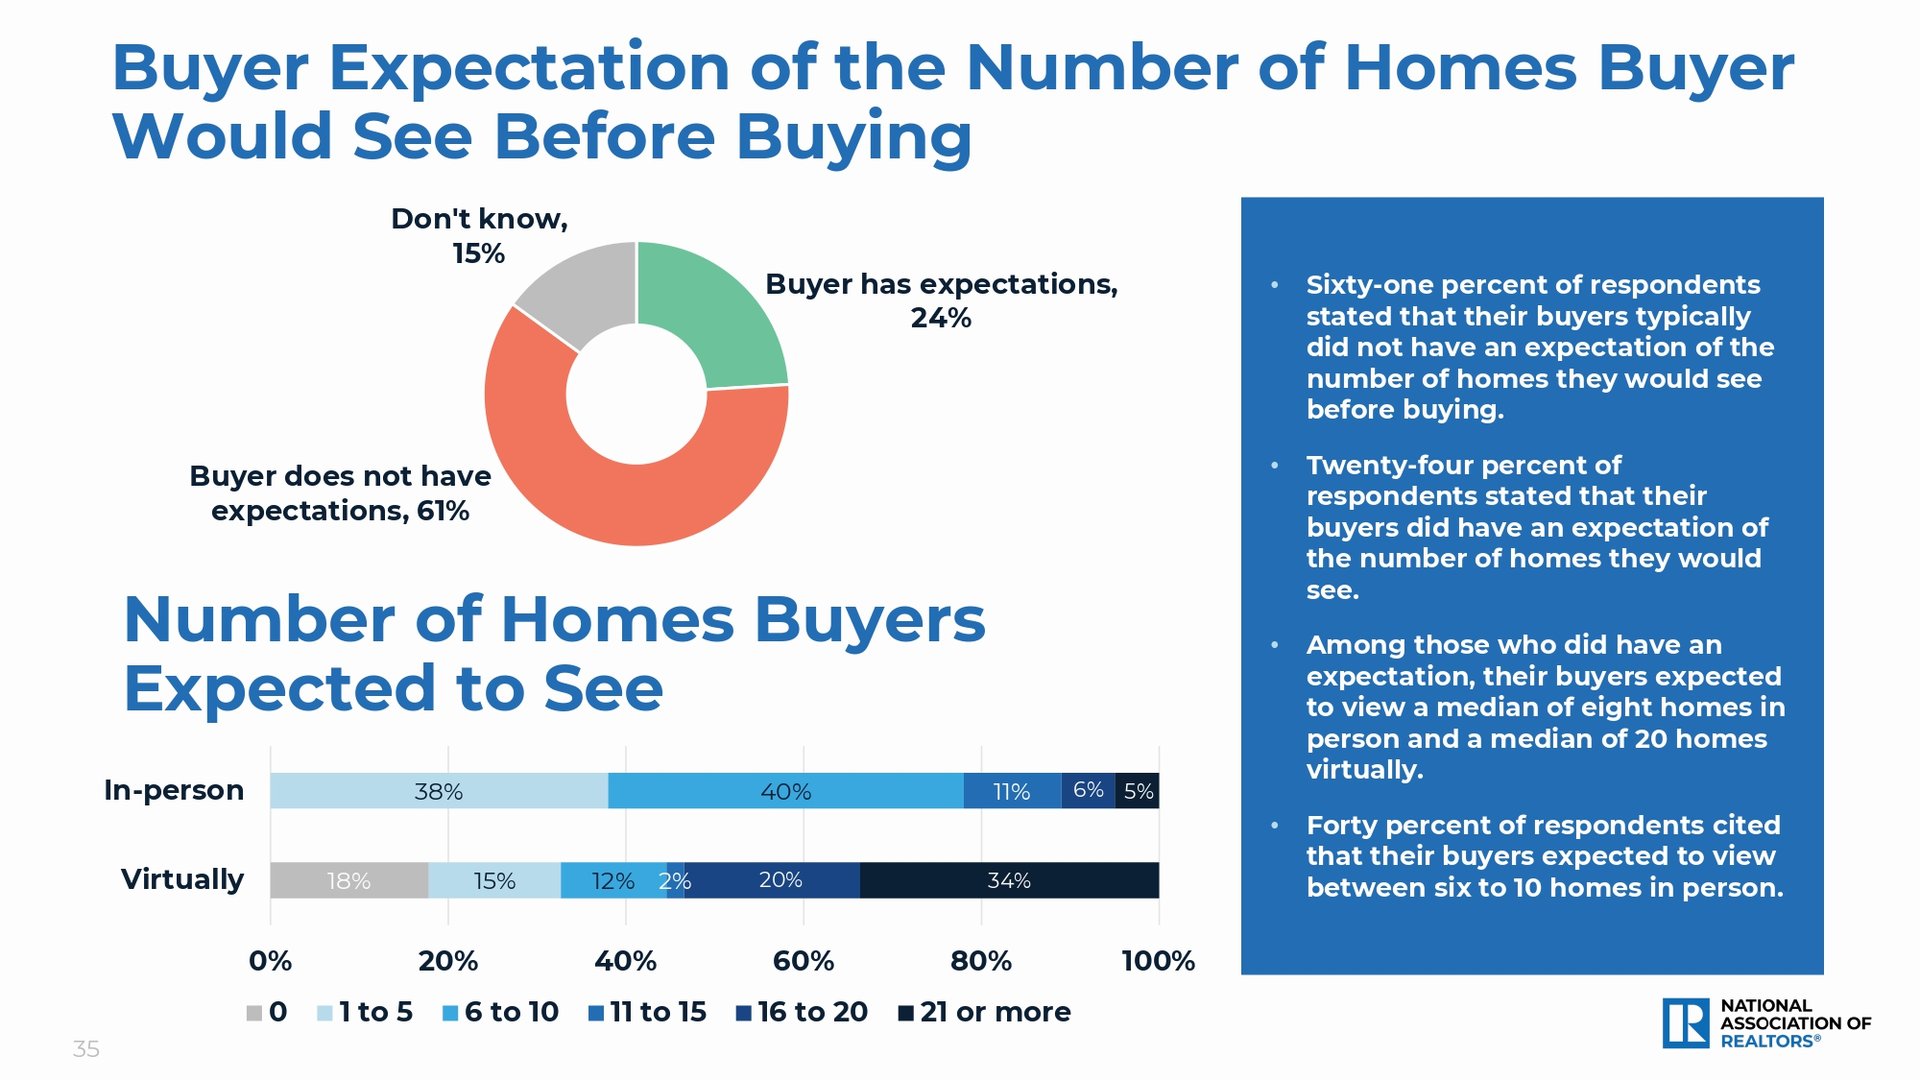
Infographic on how many homes buyers expect to see, with donut and bar charts and key survey findings.

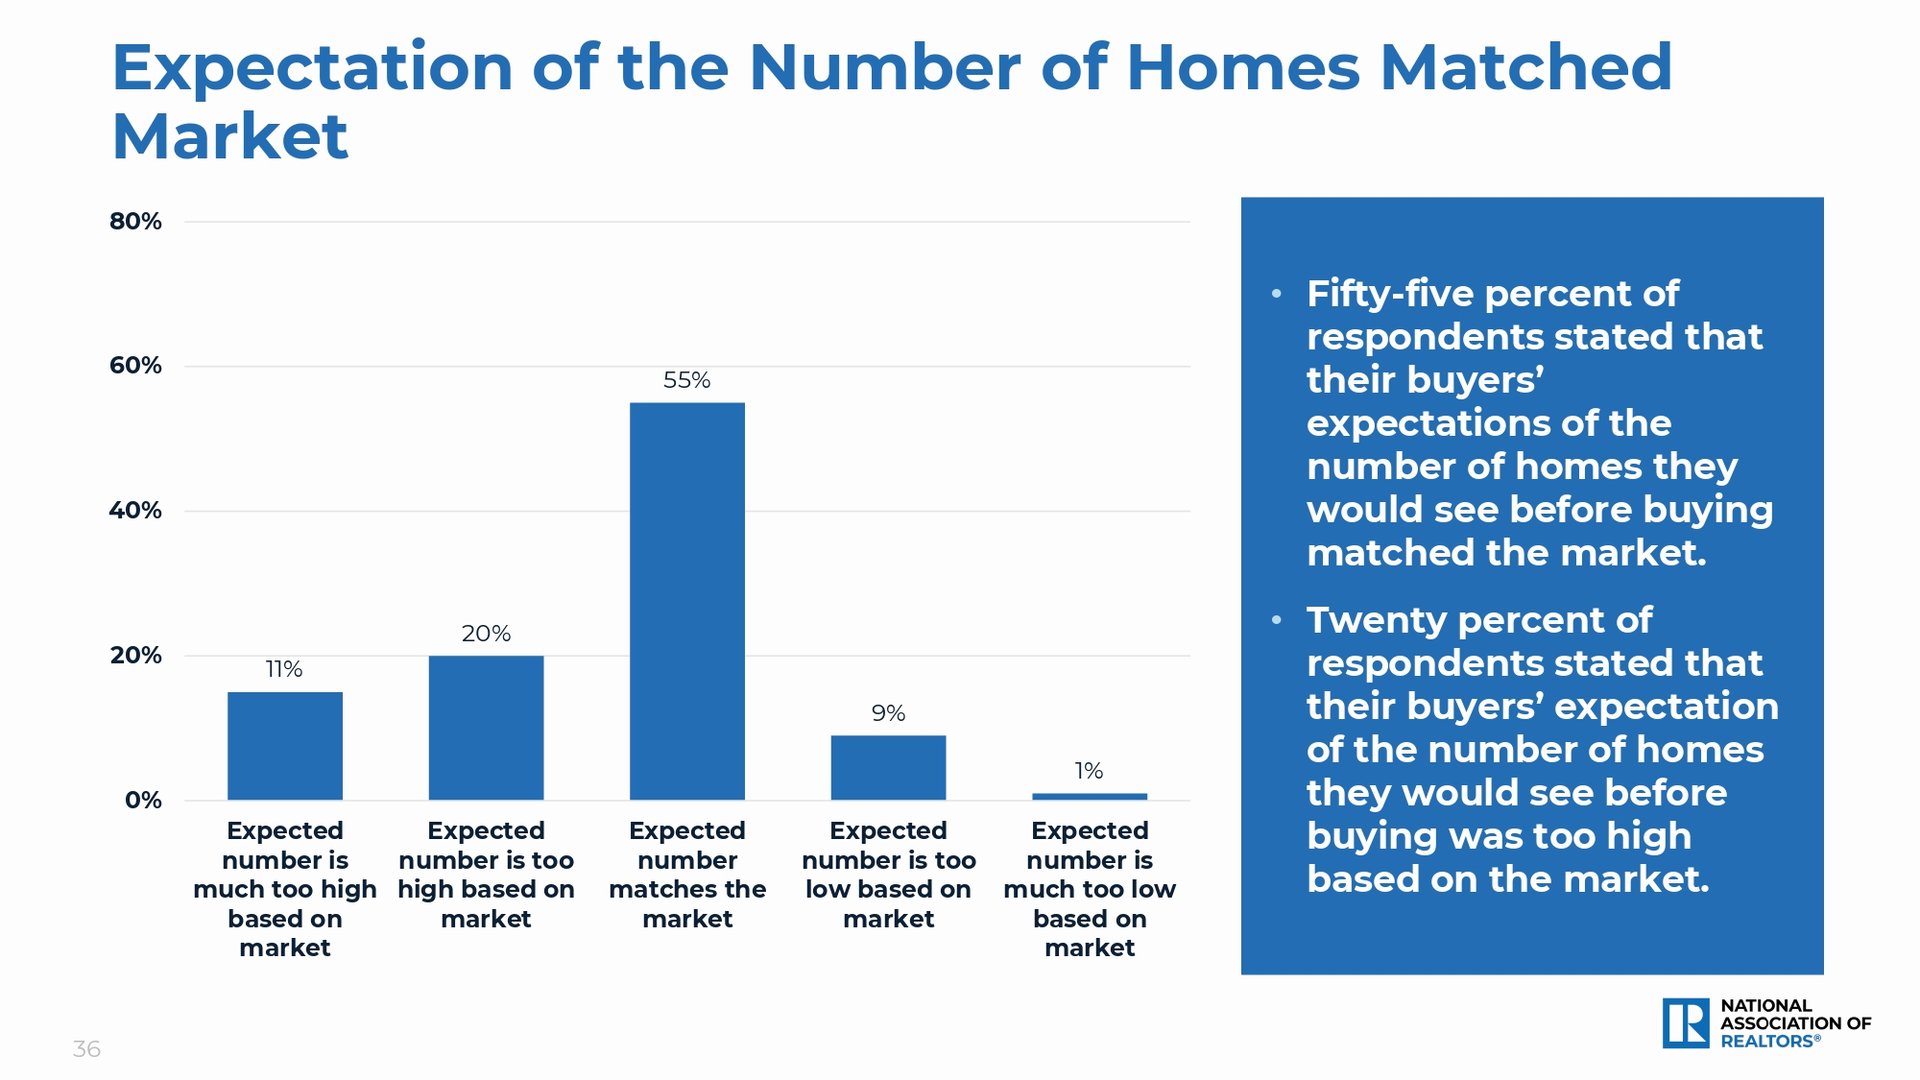
Chart showing buyers’ expectations for the number of homes to see, with 55% matching the market.

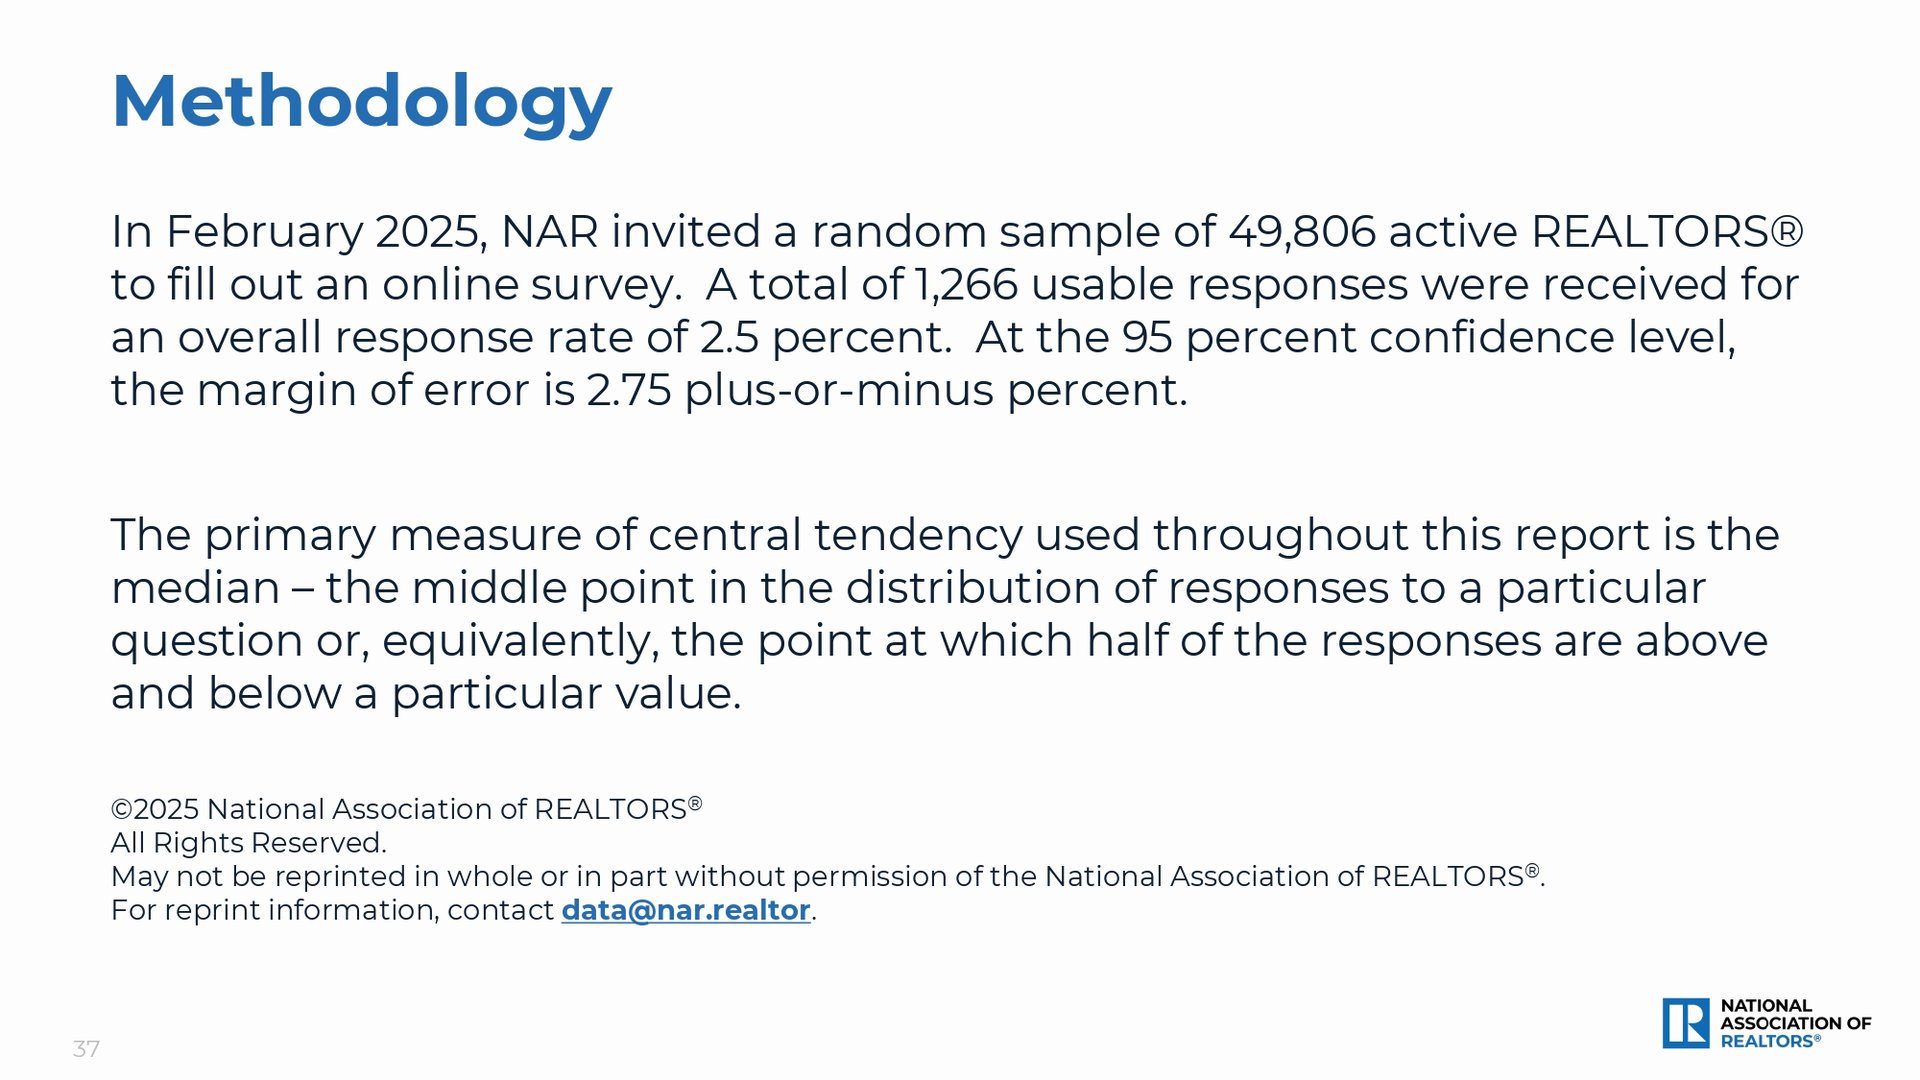
Methodology page describing the REALTOR® survey sample, response rate, margin of error, and use of the median.

National Association of REALTORS® report page describing the association and its Research Group.


2023 Profile of Home Staging report cover from the National Association of REALTORS® Research Group.
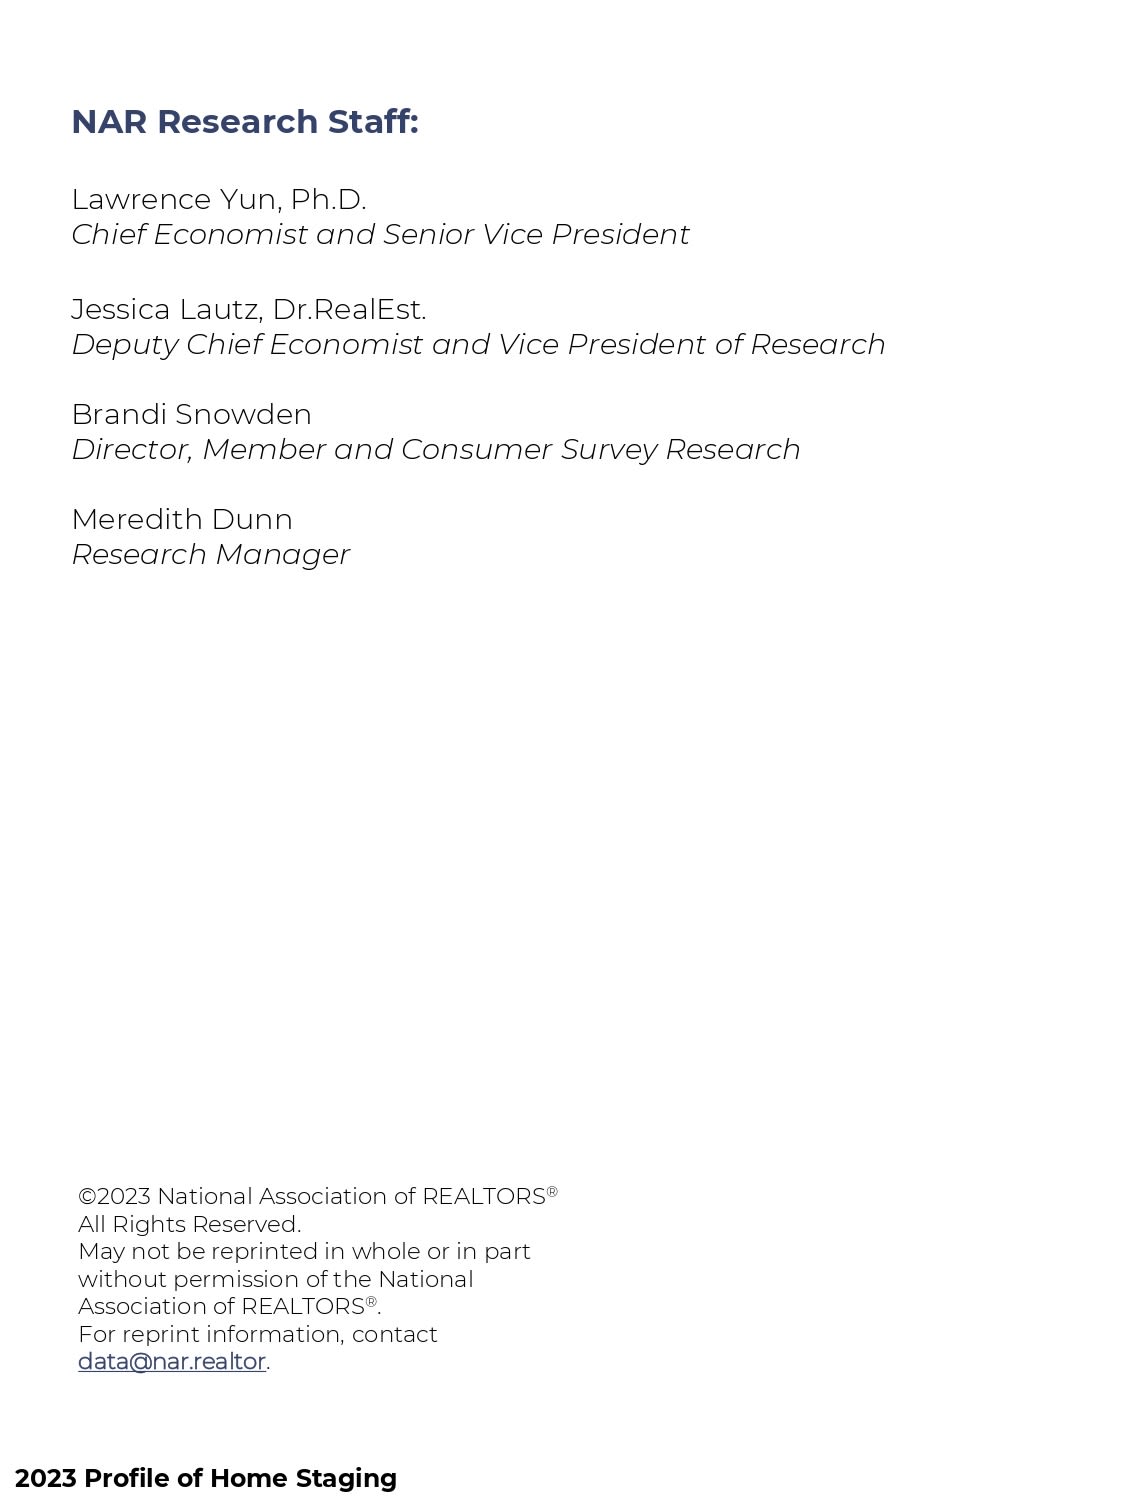
NAR research staff credits and copyright information from the 2023 Profile of Home Staging.
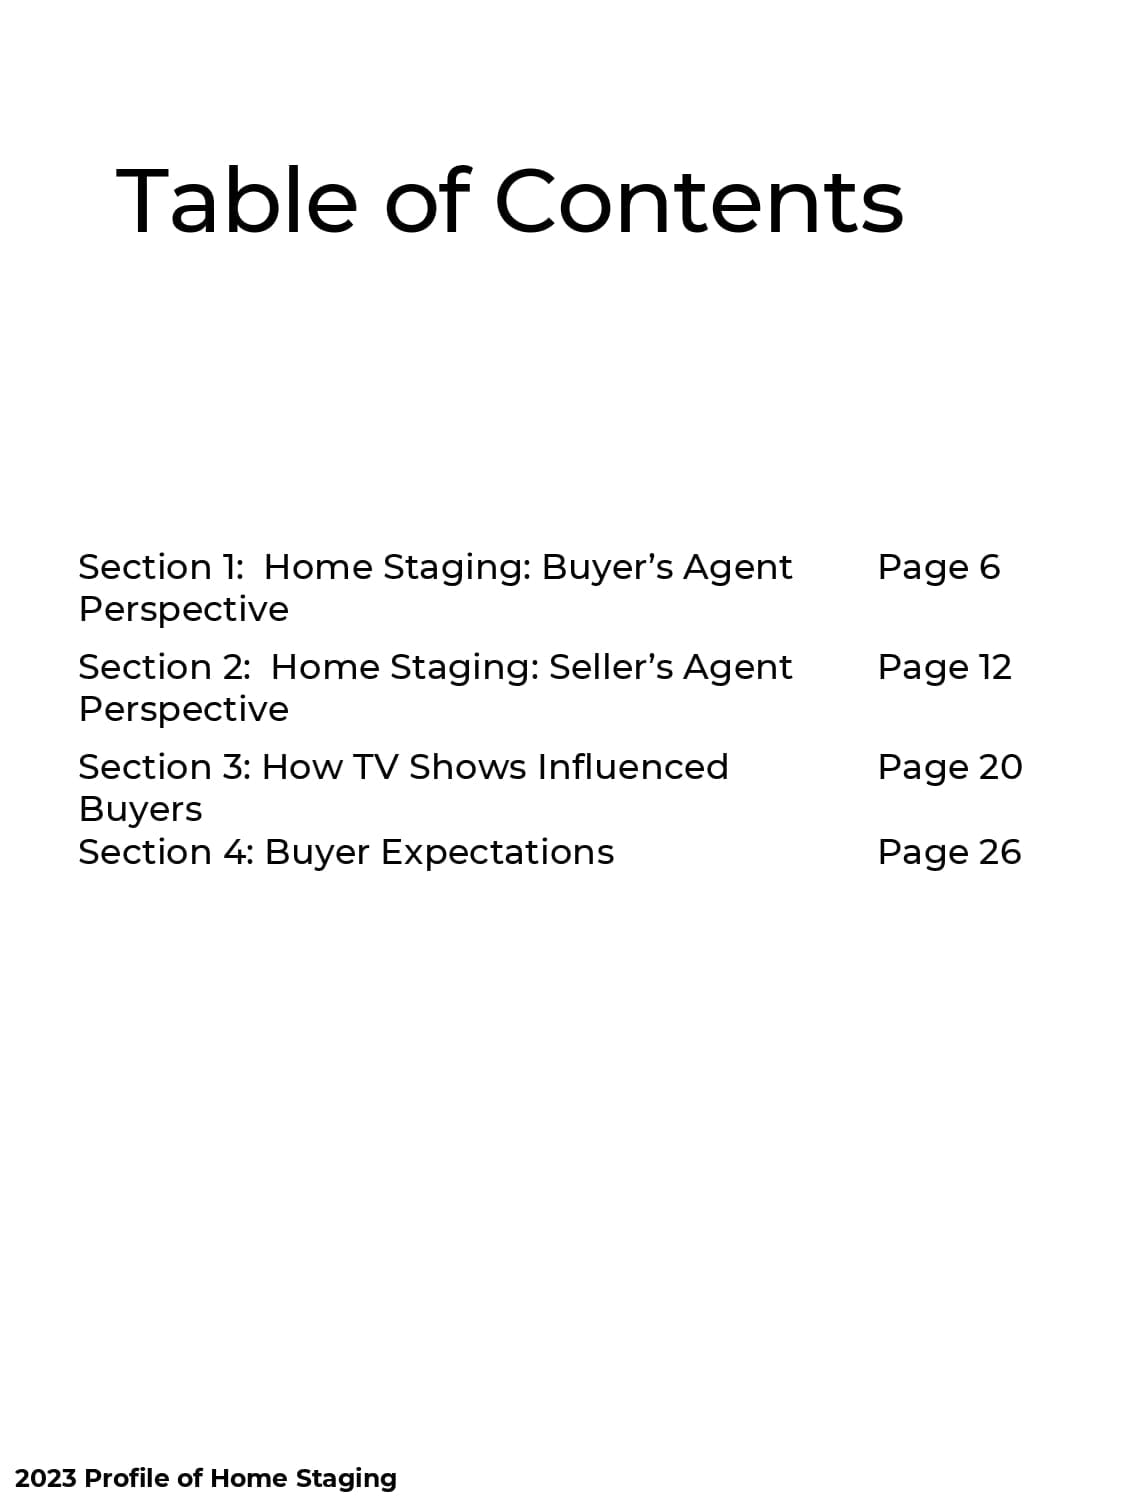
Table of contents for the 2023 Profile of Home Staging, listing four sections and their page numbers.
Executive summary infographic summarizing buyer and seller agent findings on home staging.
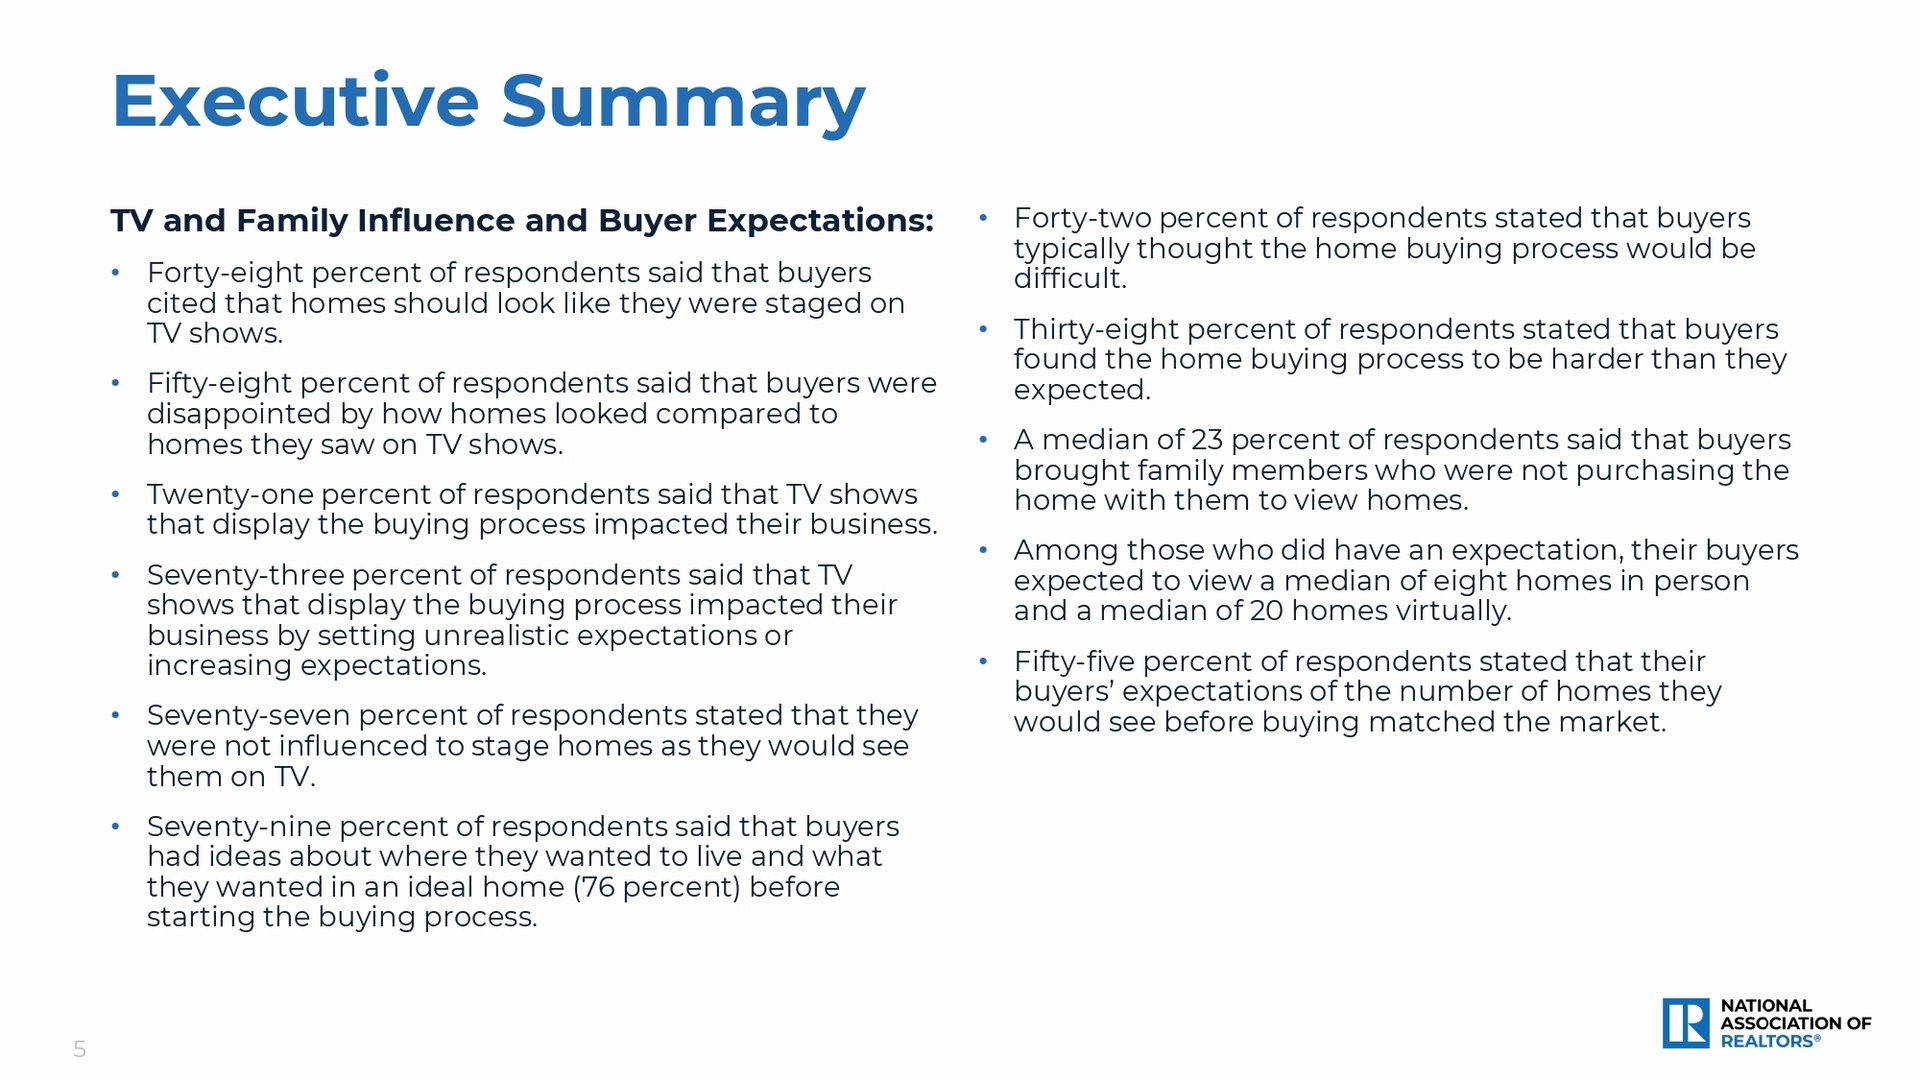
Executive summary page from the 2023 Profile of Home Staging, with findings on TV influence and buyer expectations.
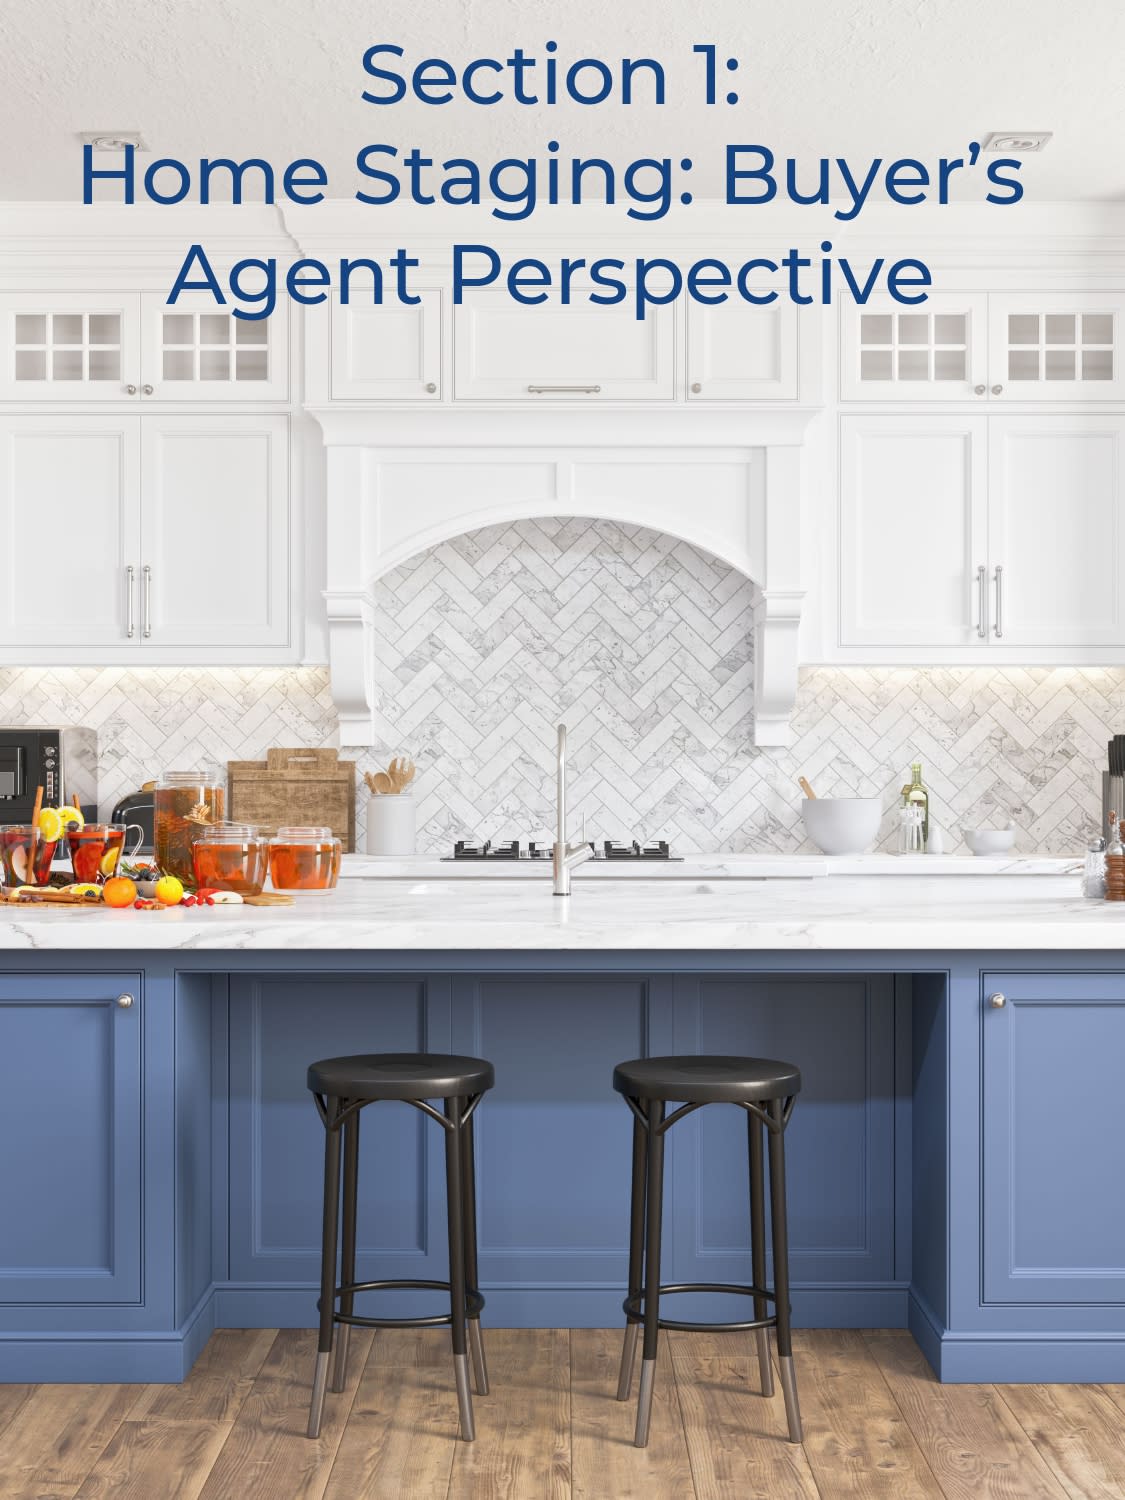
Section 1: Home Staging: Buyer’s Agent Perspective, over a bright kitchen with a blue island.
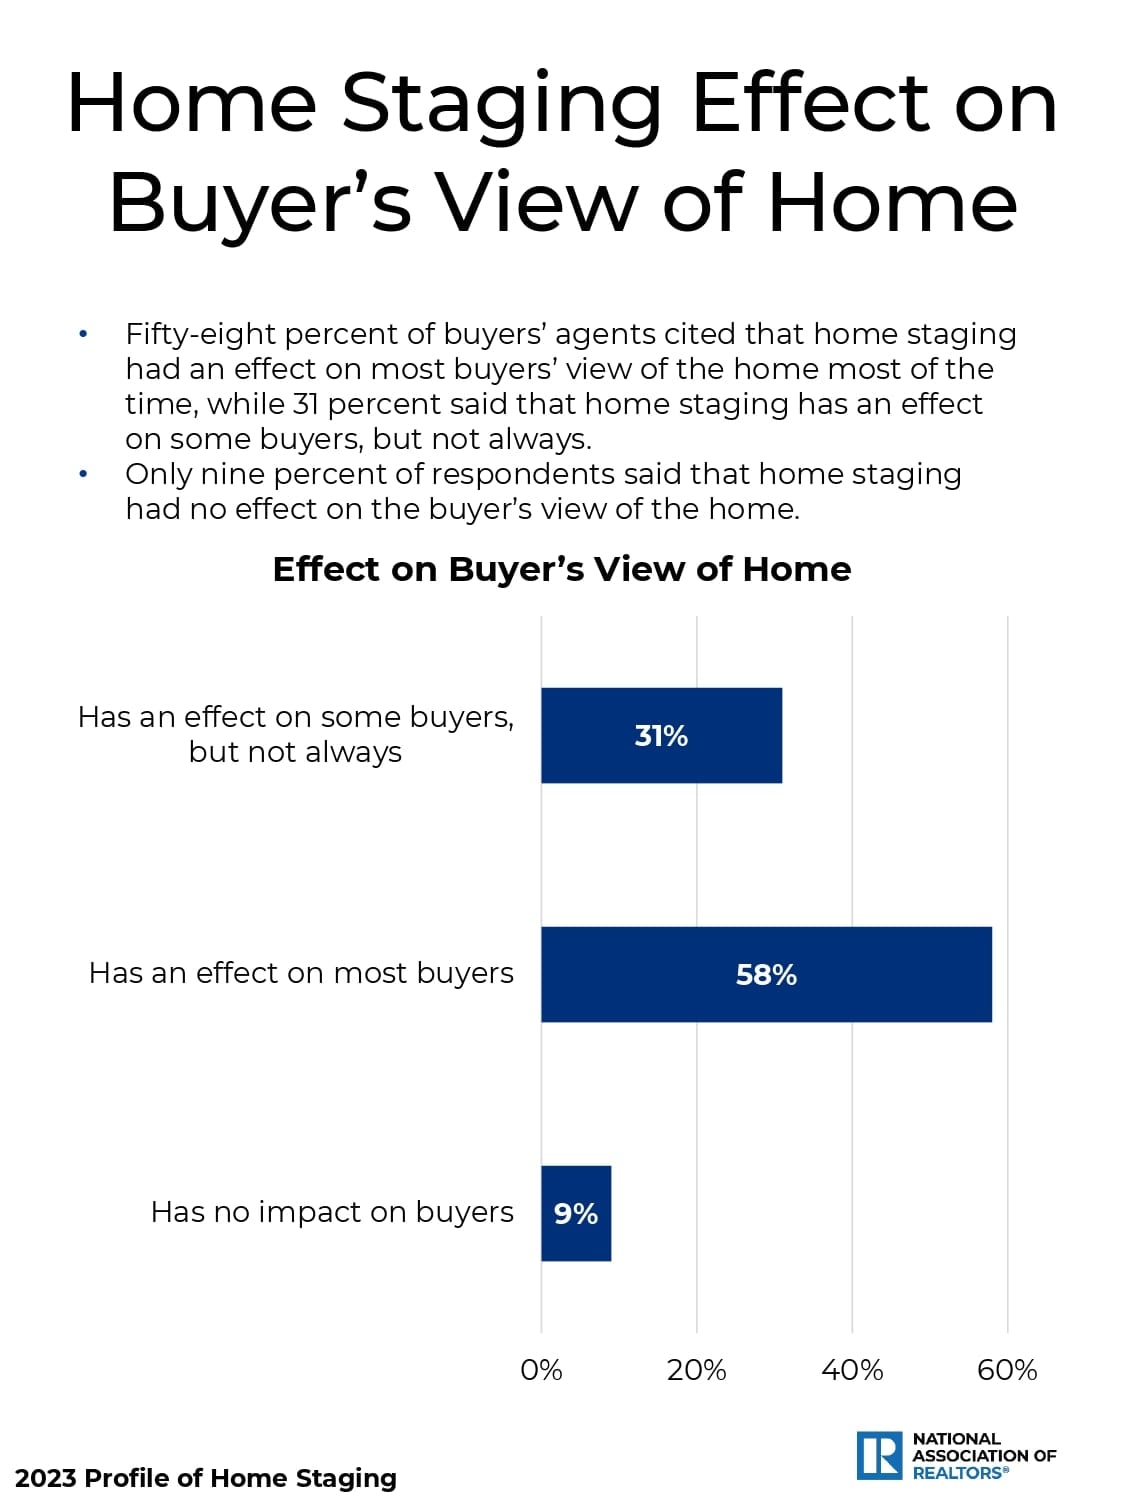
Home staging effect chart: 58% said it affects most buyers, 31% some buyers, and 9% no impact.
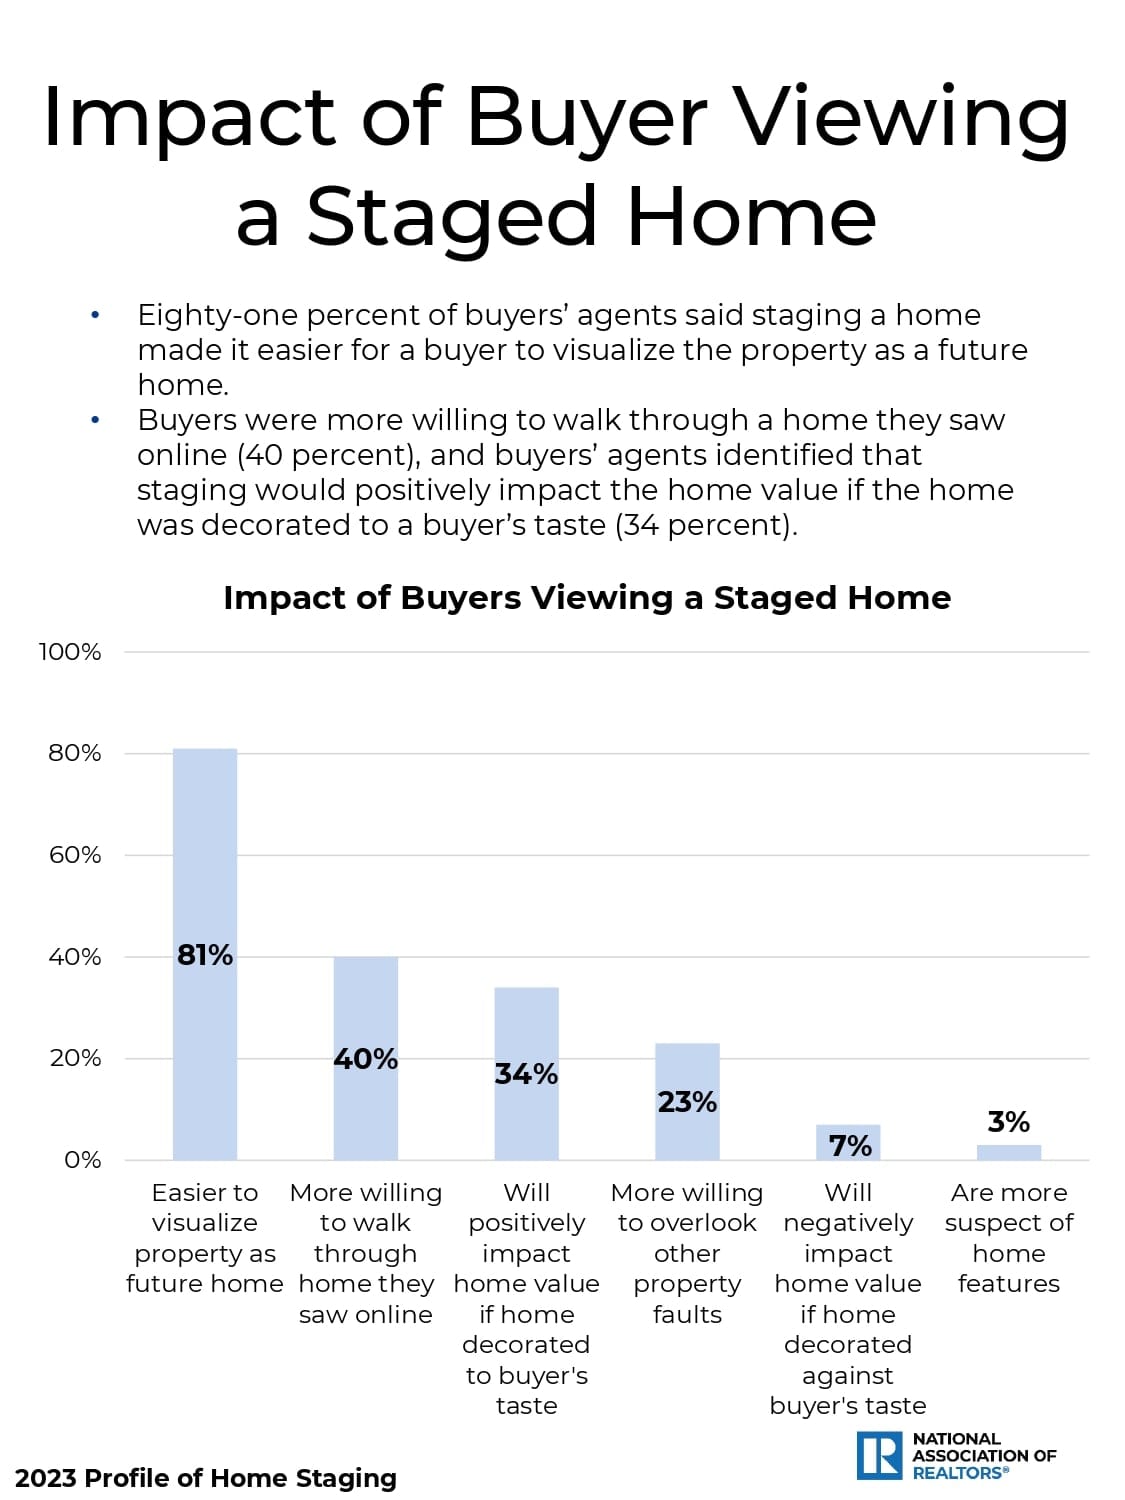
Infographic showing buyer responses to staged homes, led by 81% finding it easier to visualize the property as a future home.
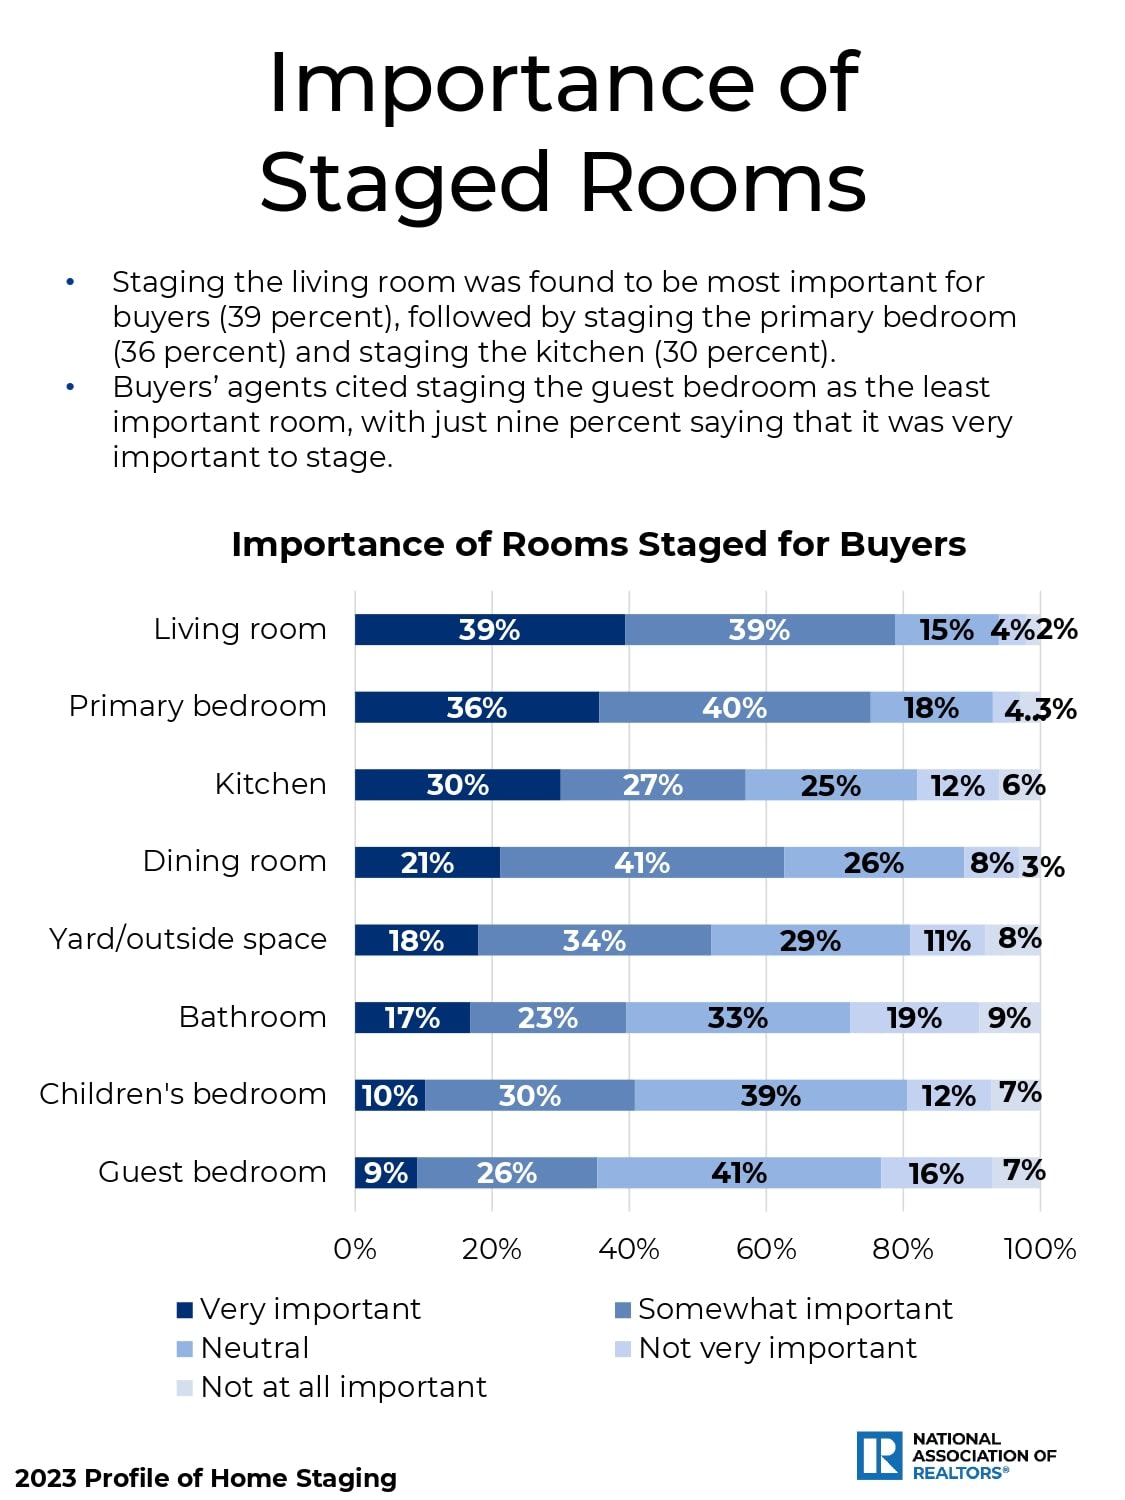
Chart showing buyer ratings of staged rooms; living rooms rank highest in importance, guest bedrooms lowest.
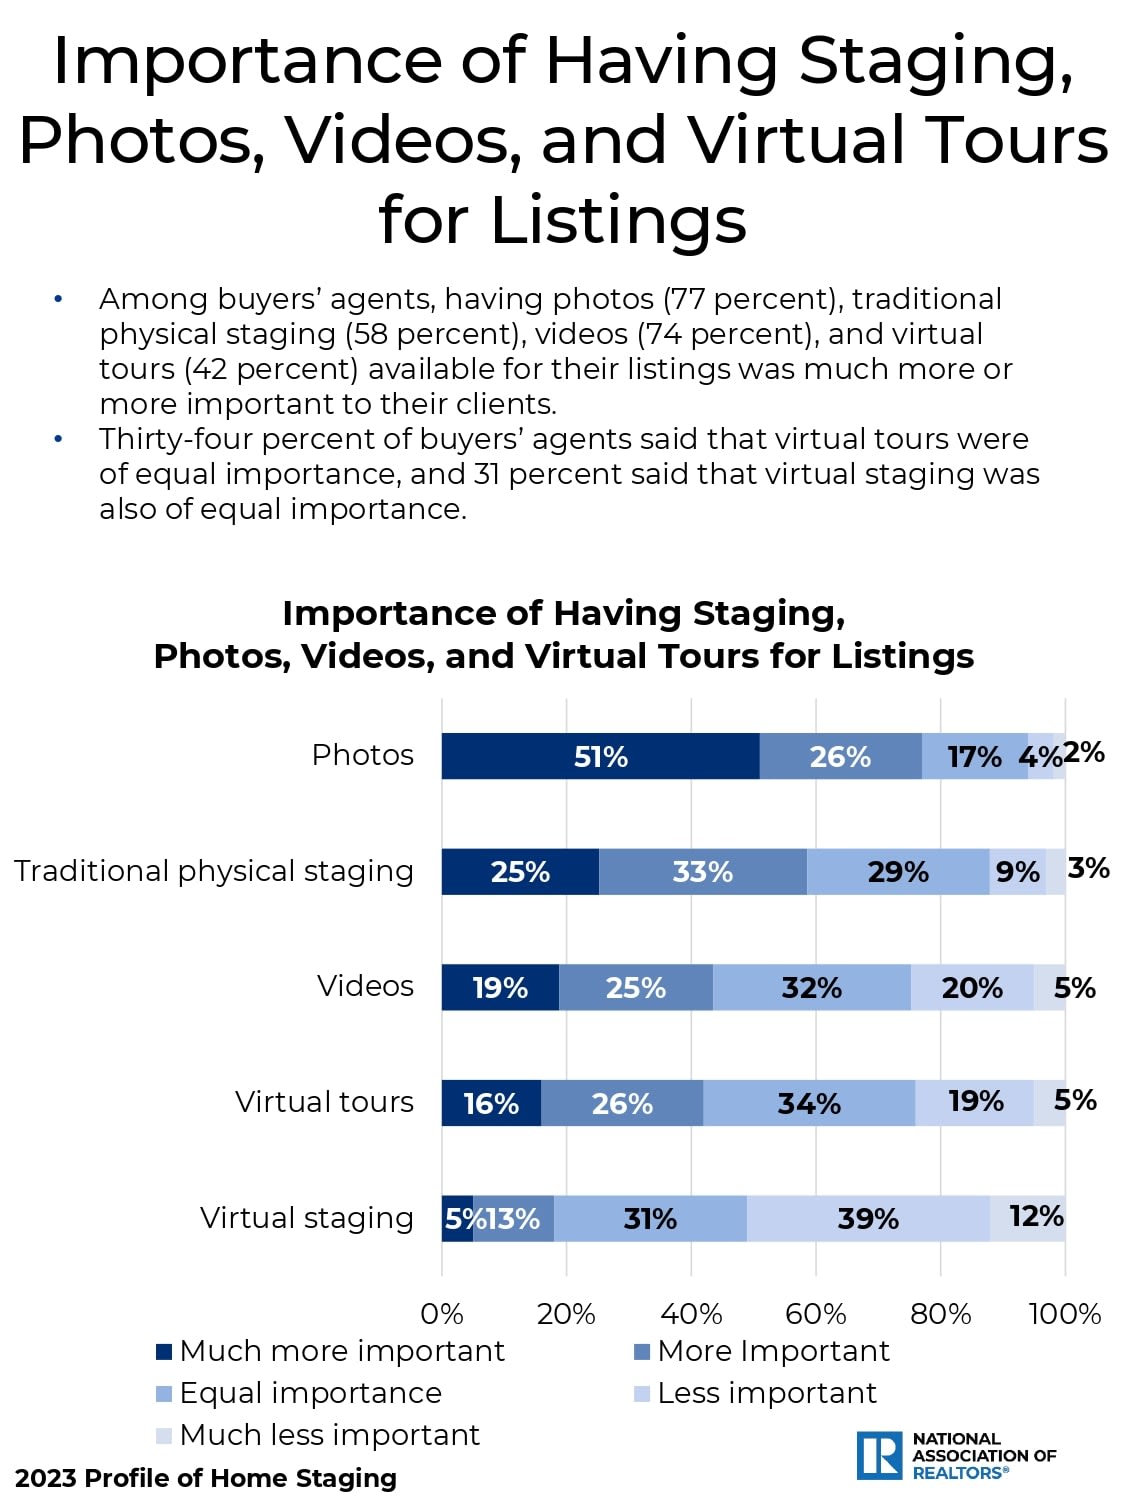
Infographic comparing buyer agents’ views on the importance of listing photos, staging, videos, and virtual tours.
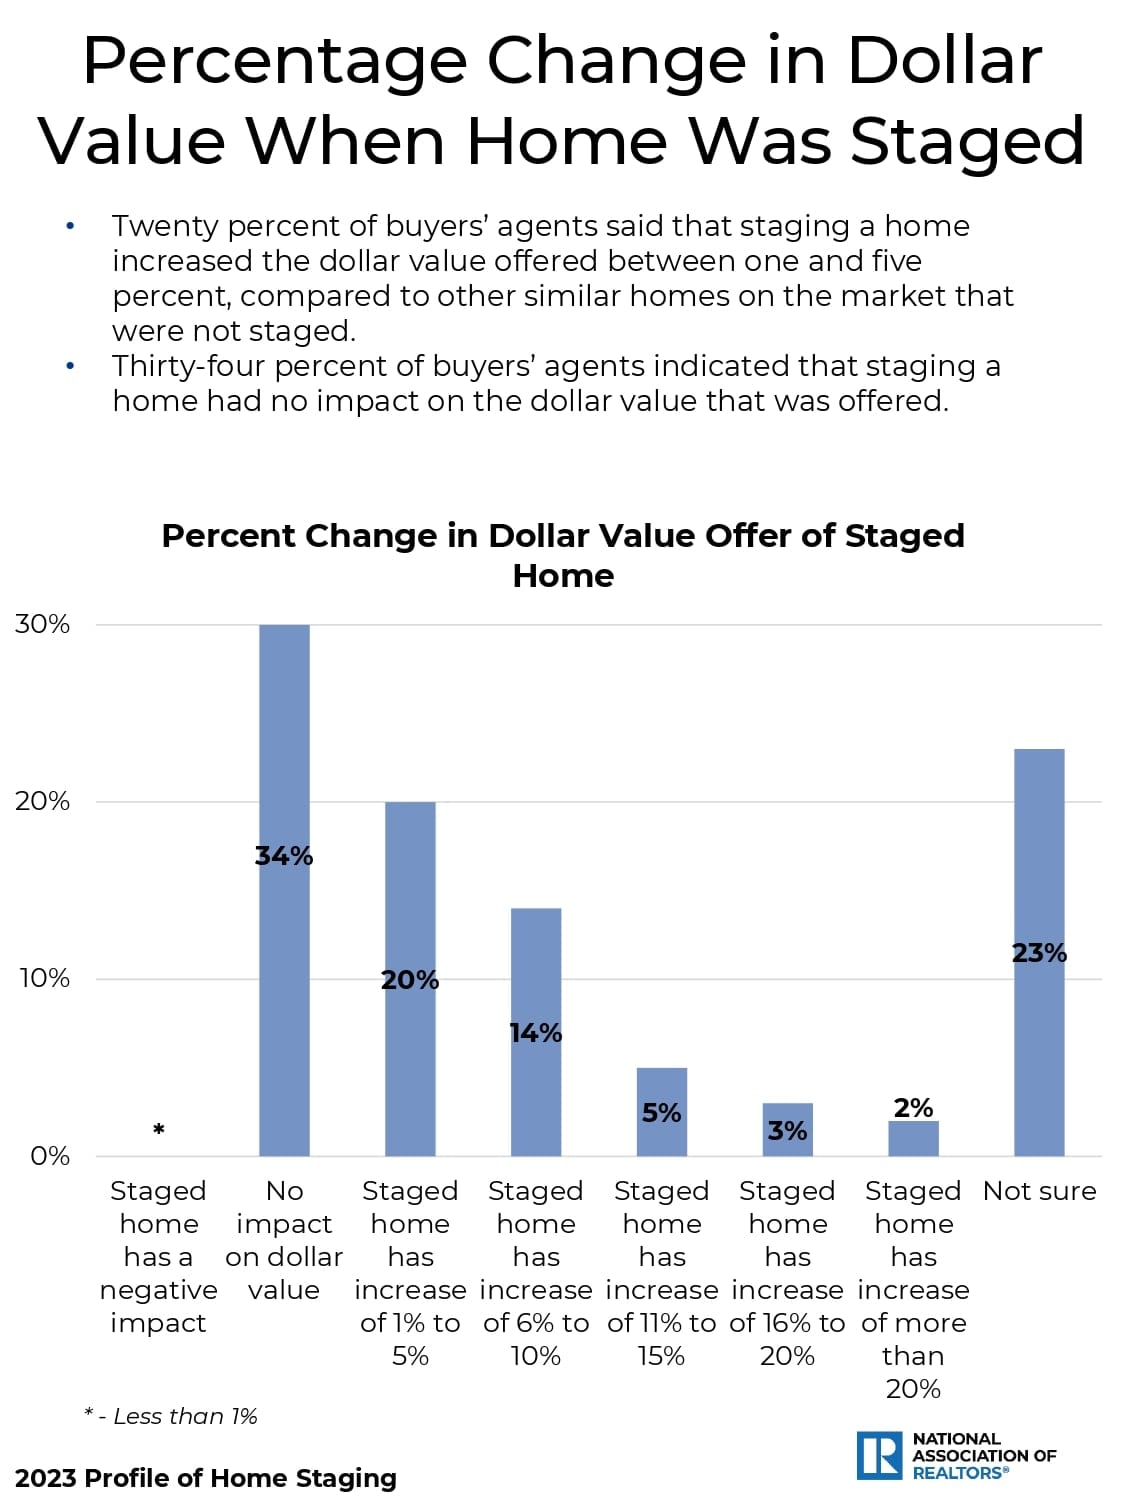
Bar chart showing survey responses on how staging affects the dollar value offered for a home.
Home Staging: Seller’s Agent Perspective, Section 2
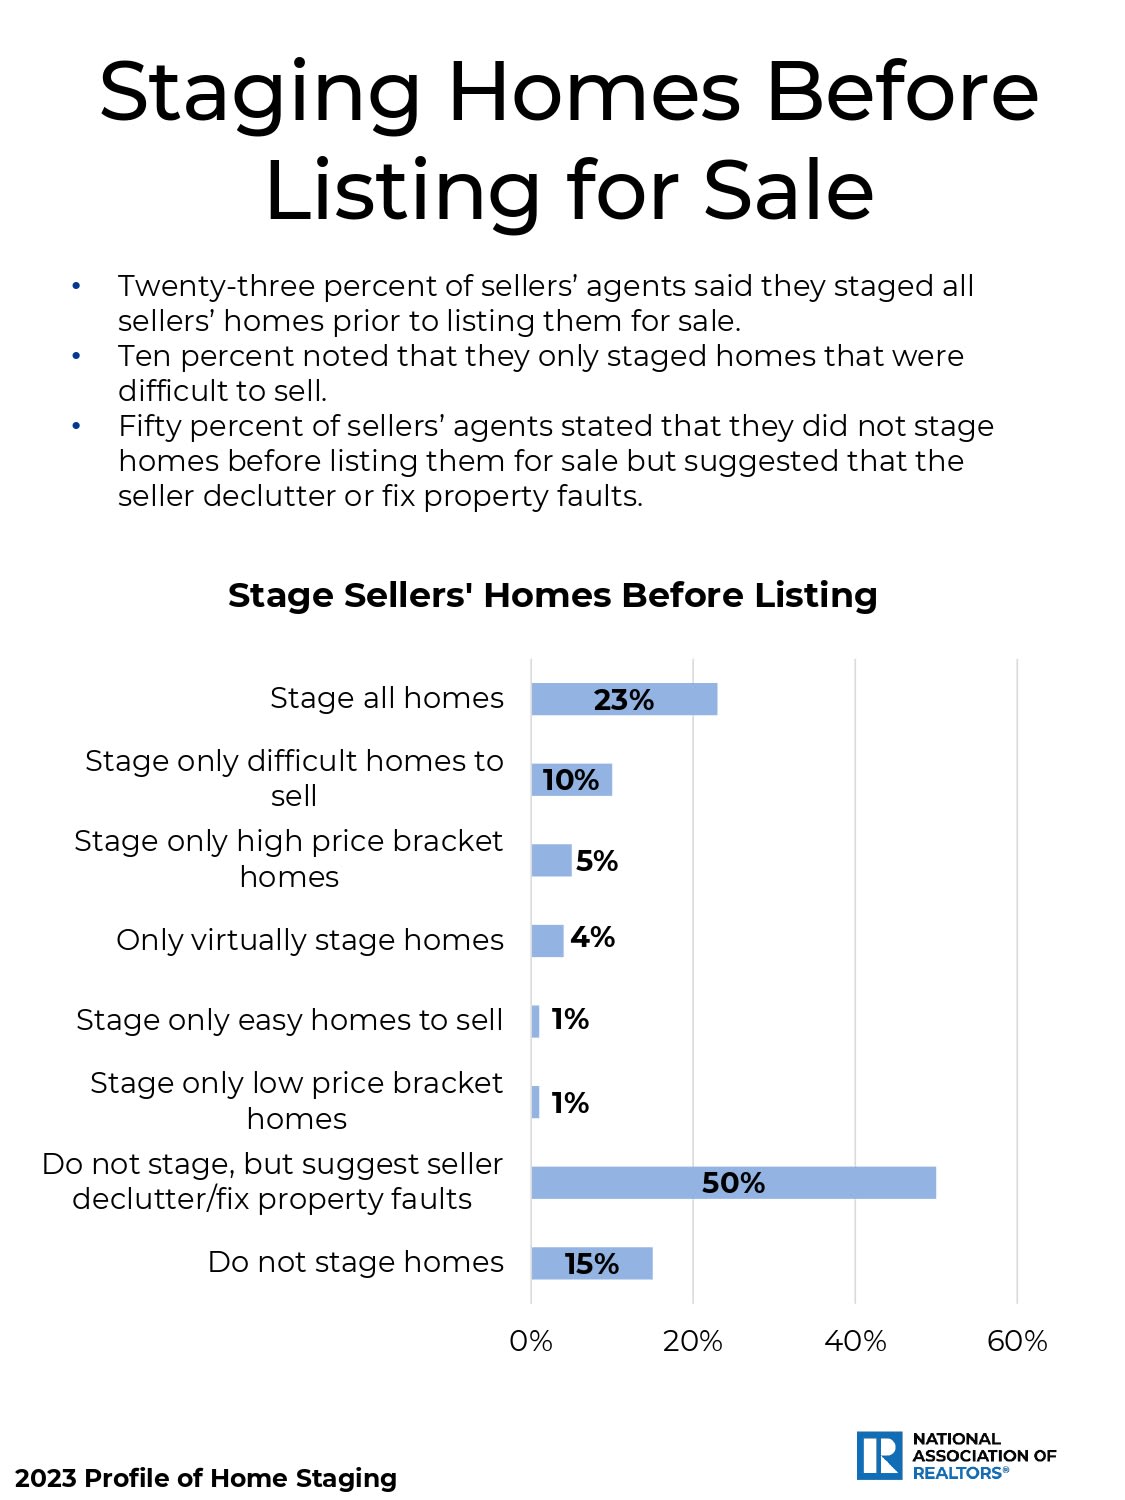
Infographic summarizing agents’ home-staging practices, with survey percentages and a horizontal bar chart.
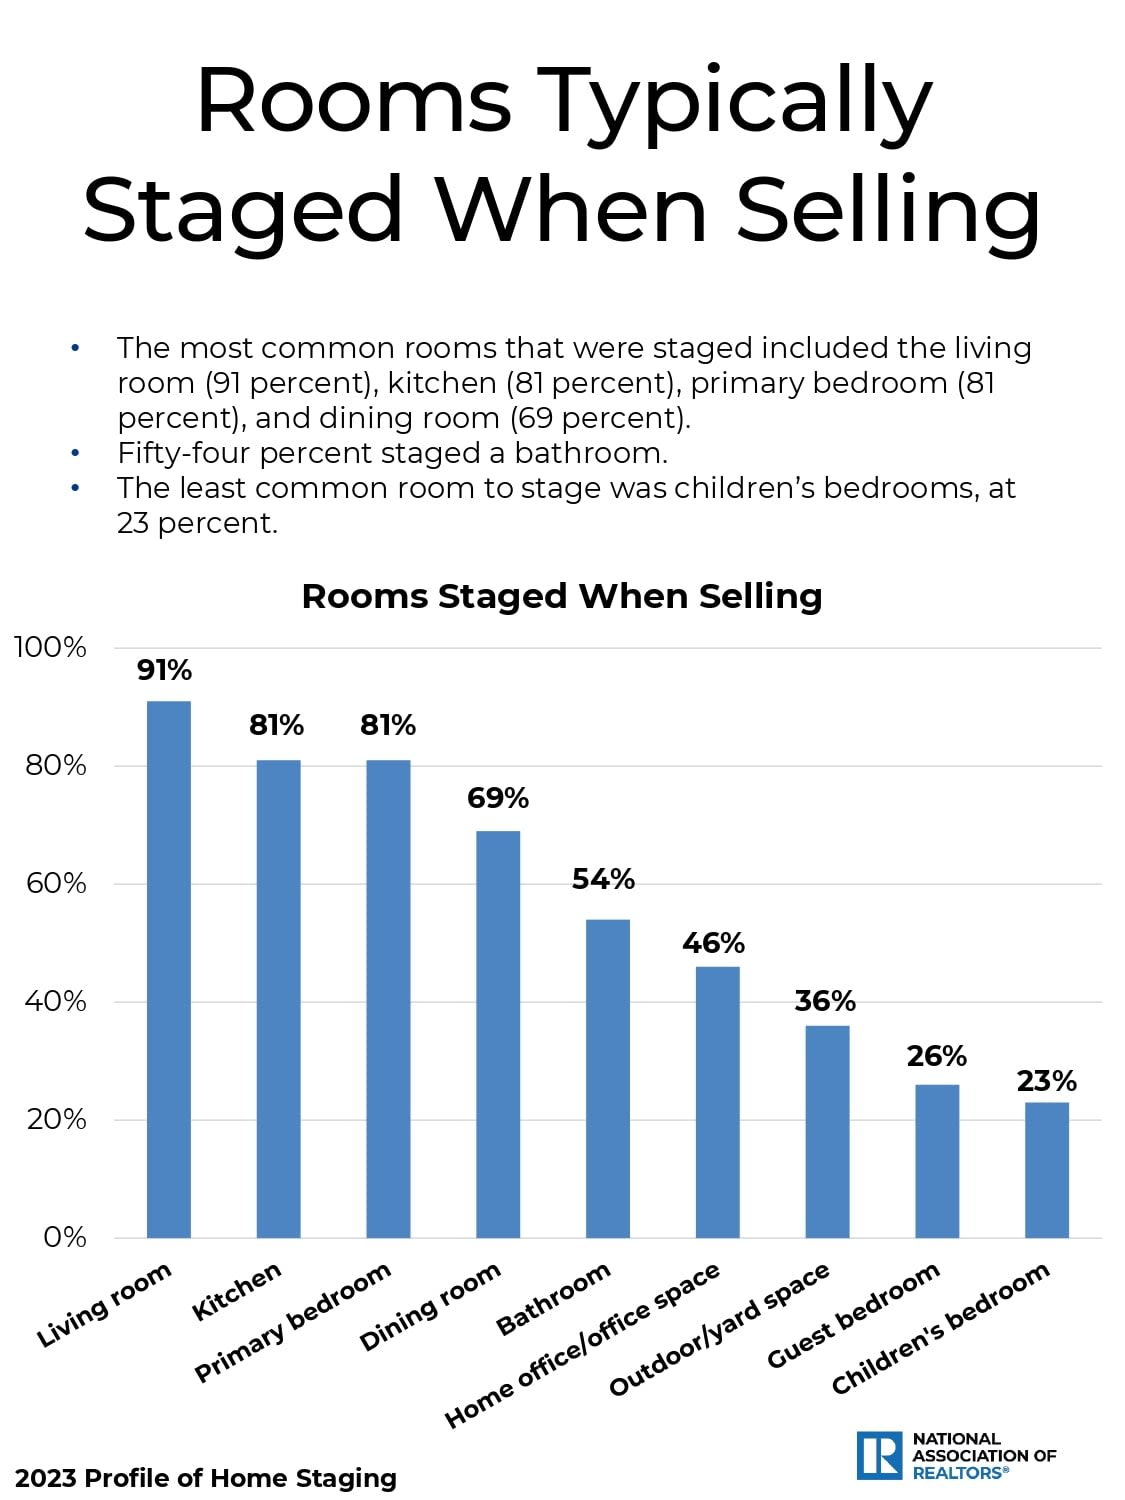
Infographic showing staging rates by room, led by living rooms at 91% and ending with children’s bedrooms at 23%.
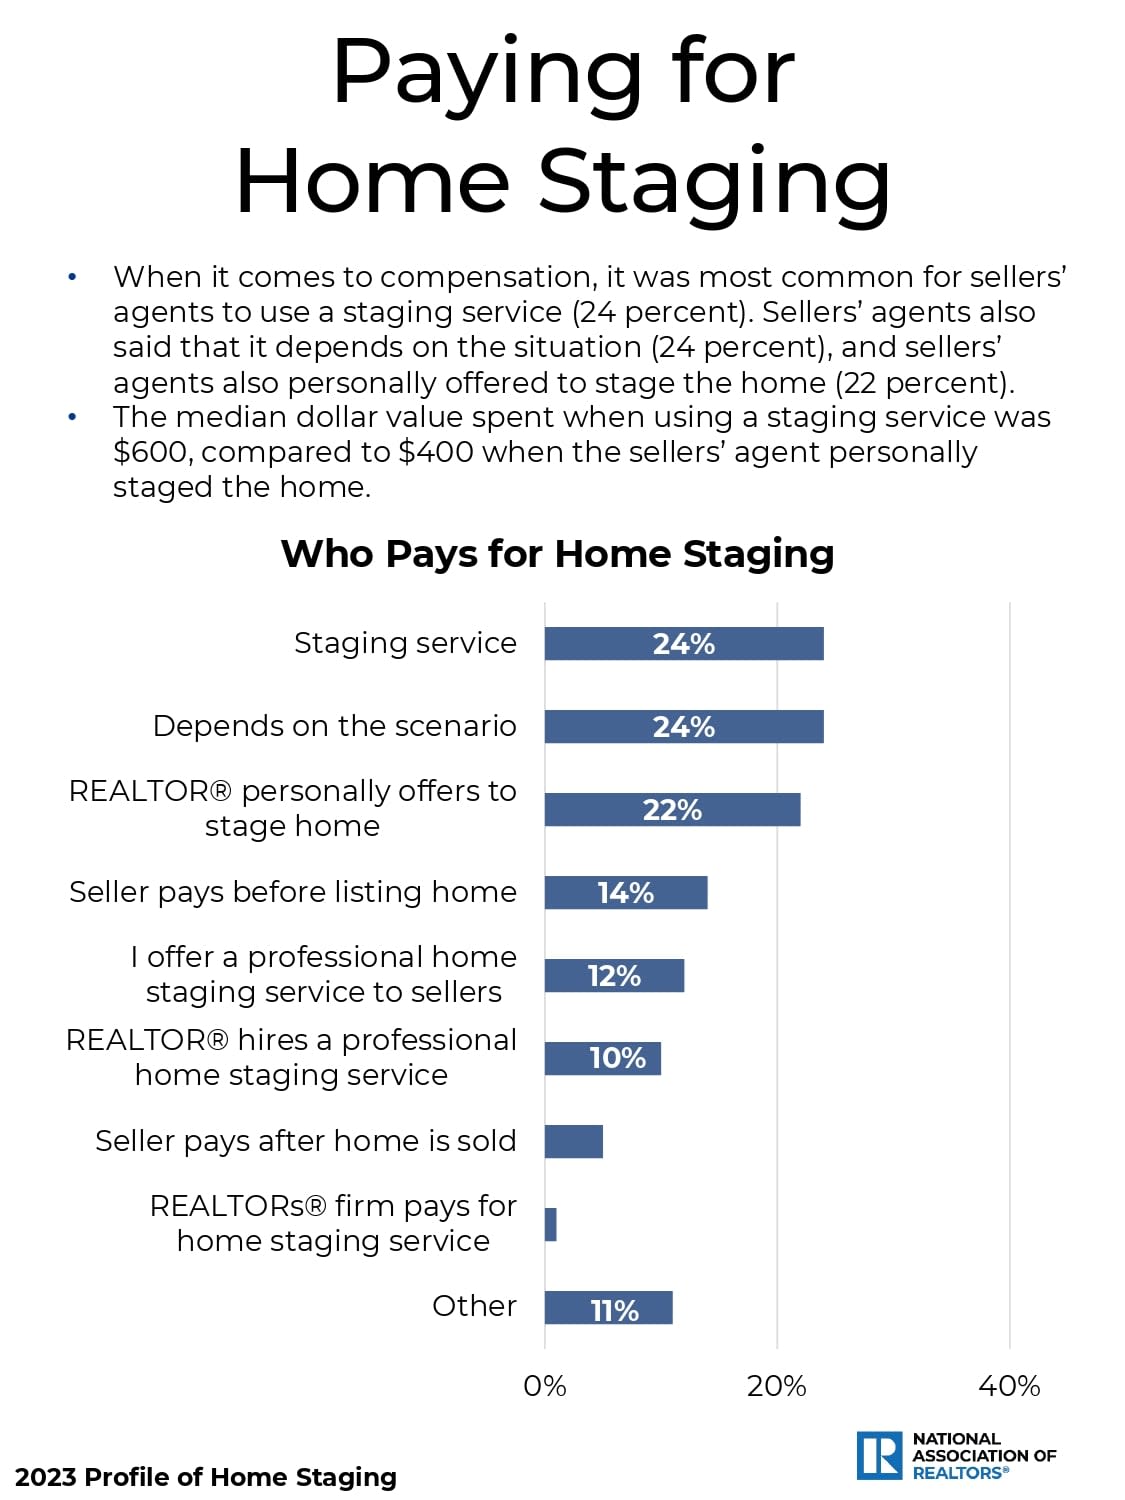
Chart showing who pays for home staging, led by staging services and scenario-dependent arrangements at 24% each.
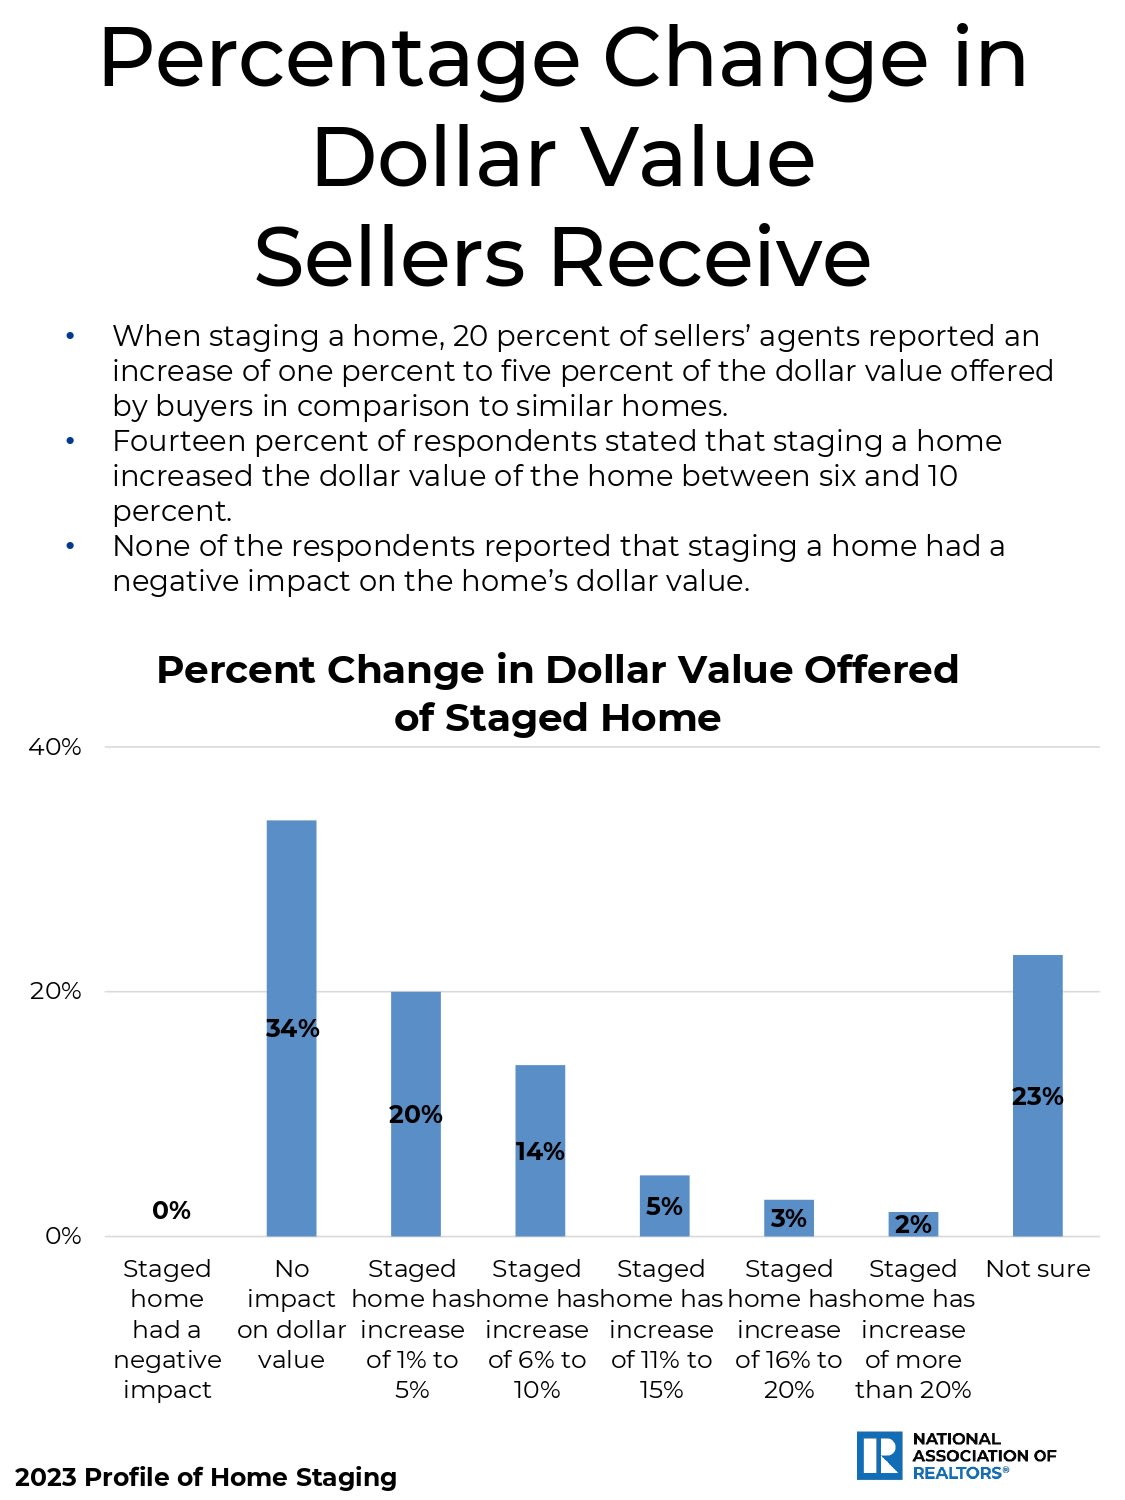
Infographic showing reported changes in home value after staging, with a bar chart and survey findings.
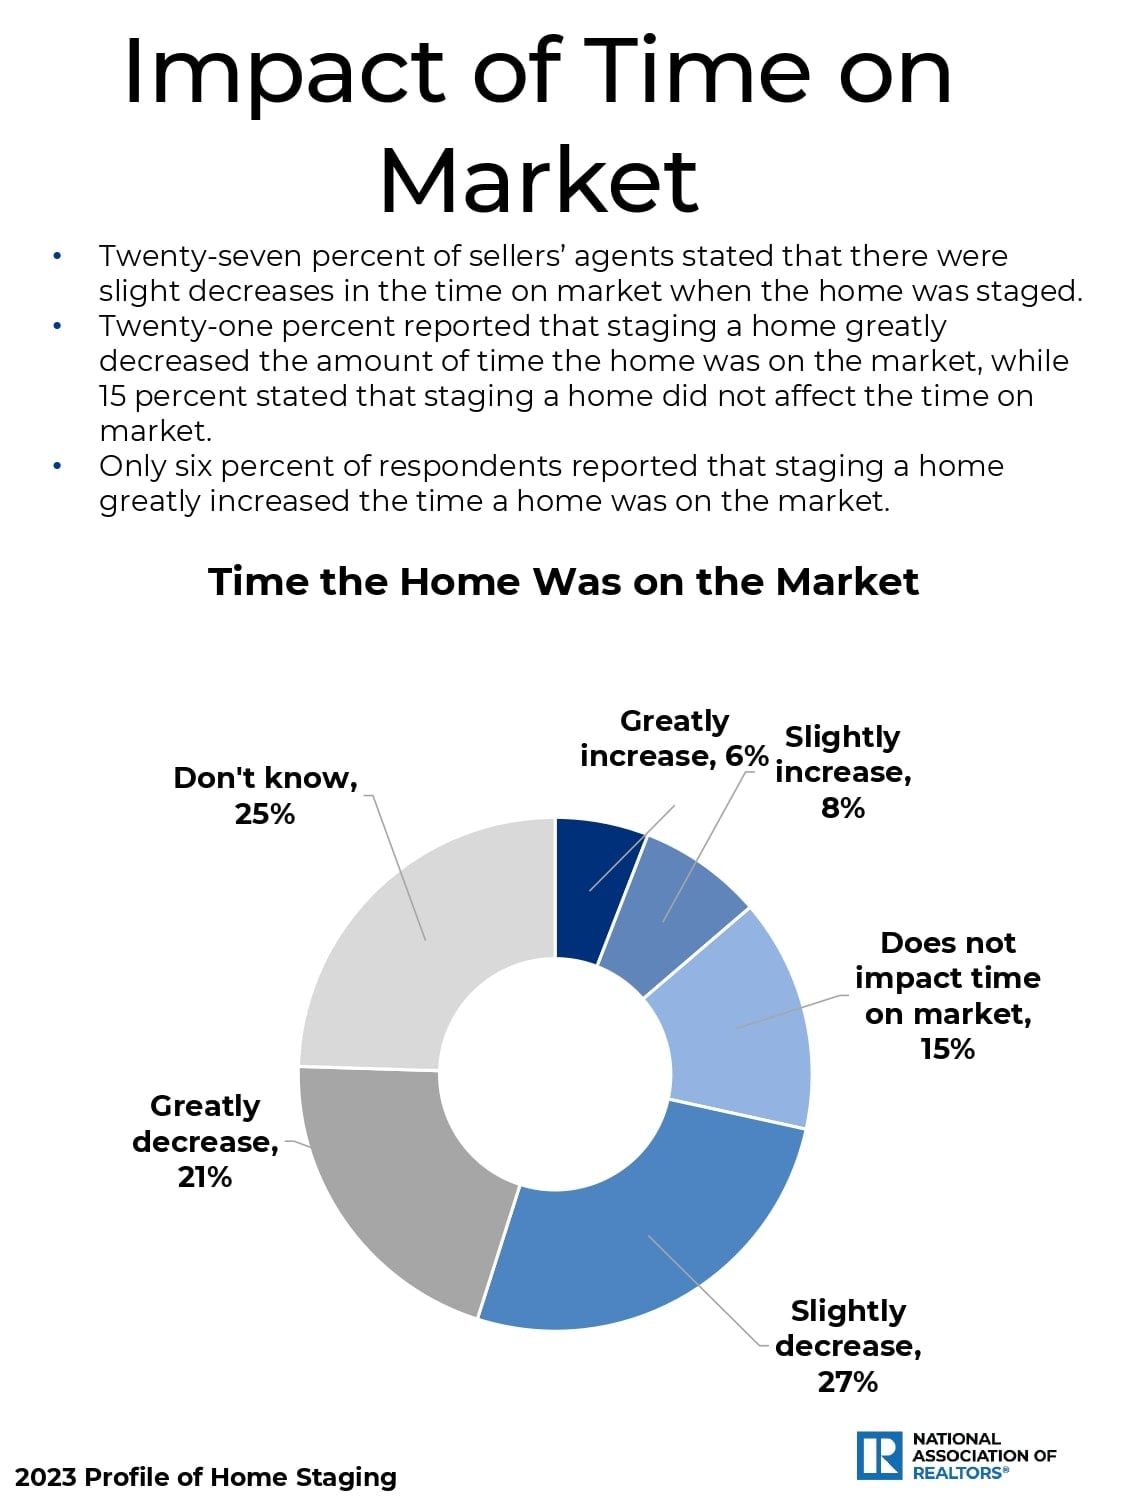
Home staging time-on-market infographic: 27% slight decrease, 21% great decrease, 15% no impact, 25% don't know.
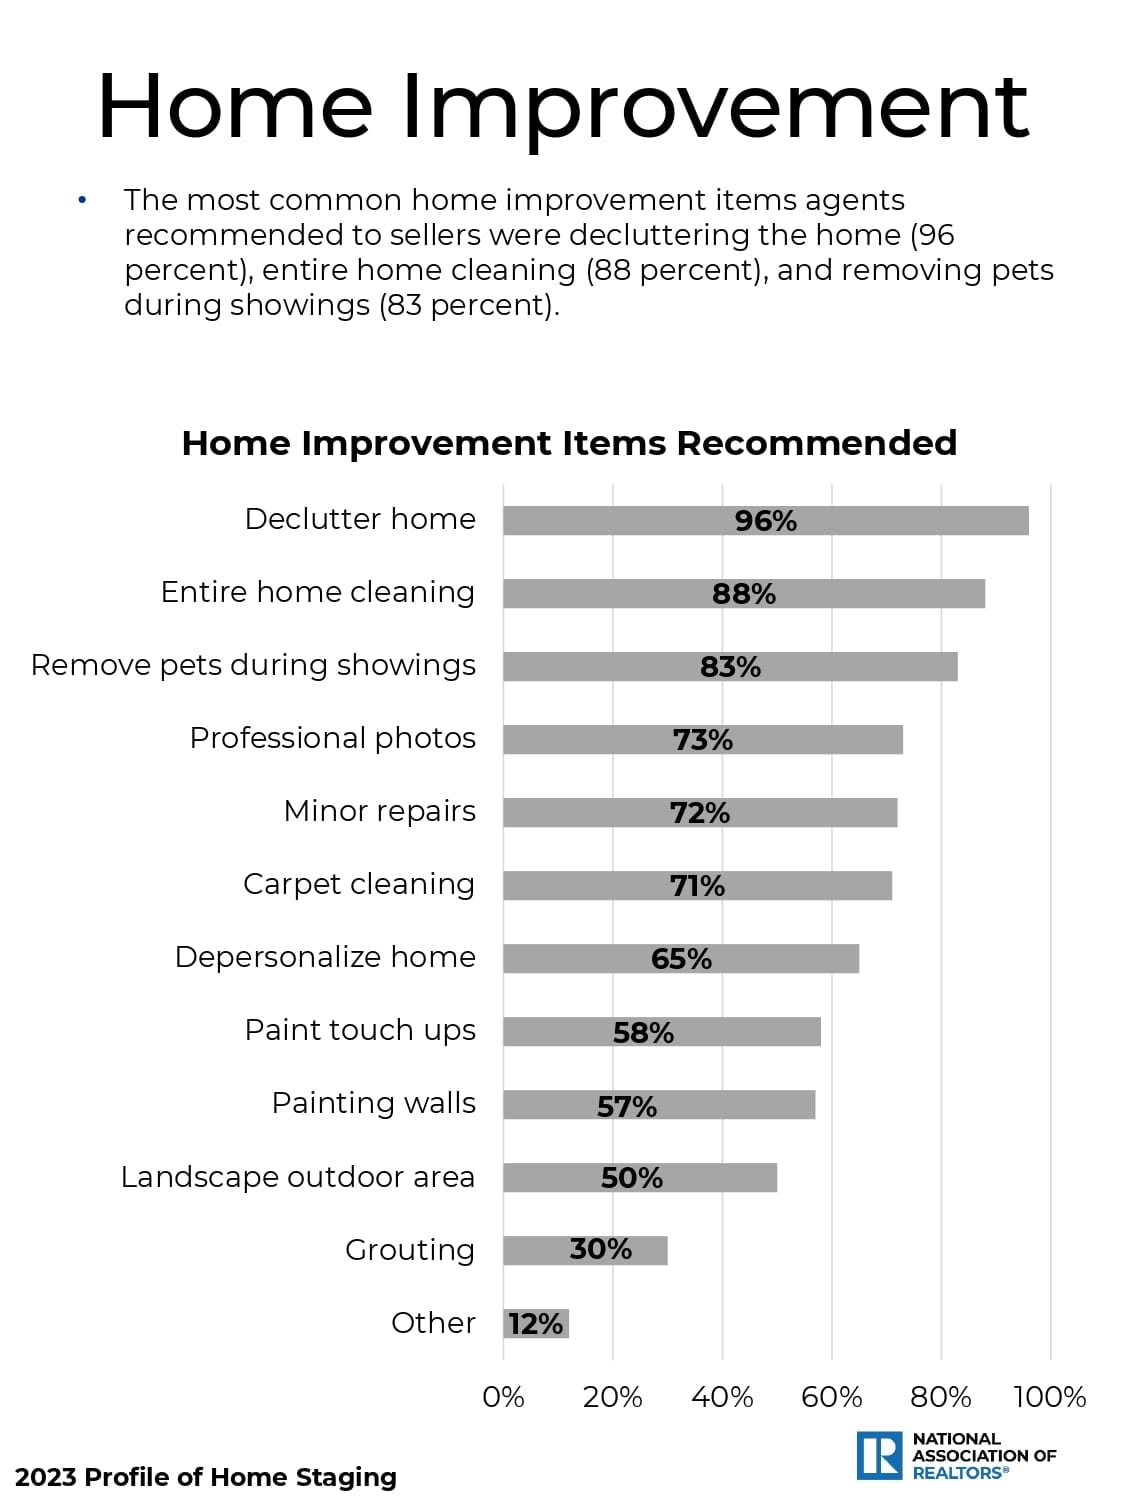
Bar chart of recommended home improvements, led by decluttering at 96%, cleaning at 88%, and removing pets at 83%.
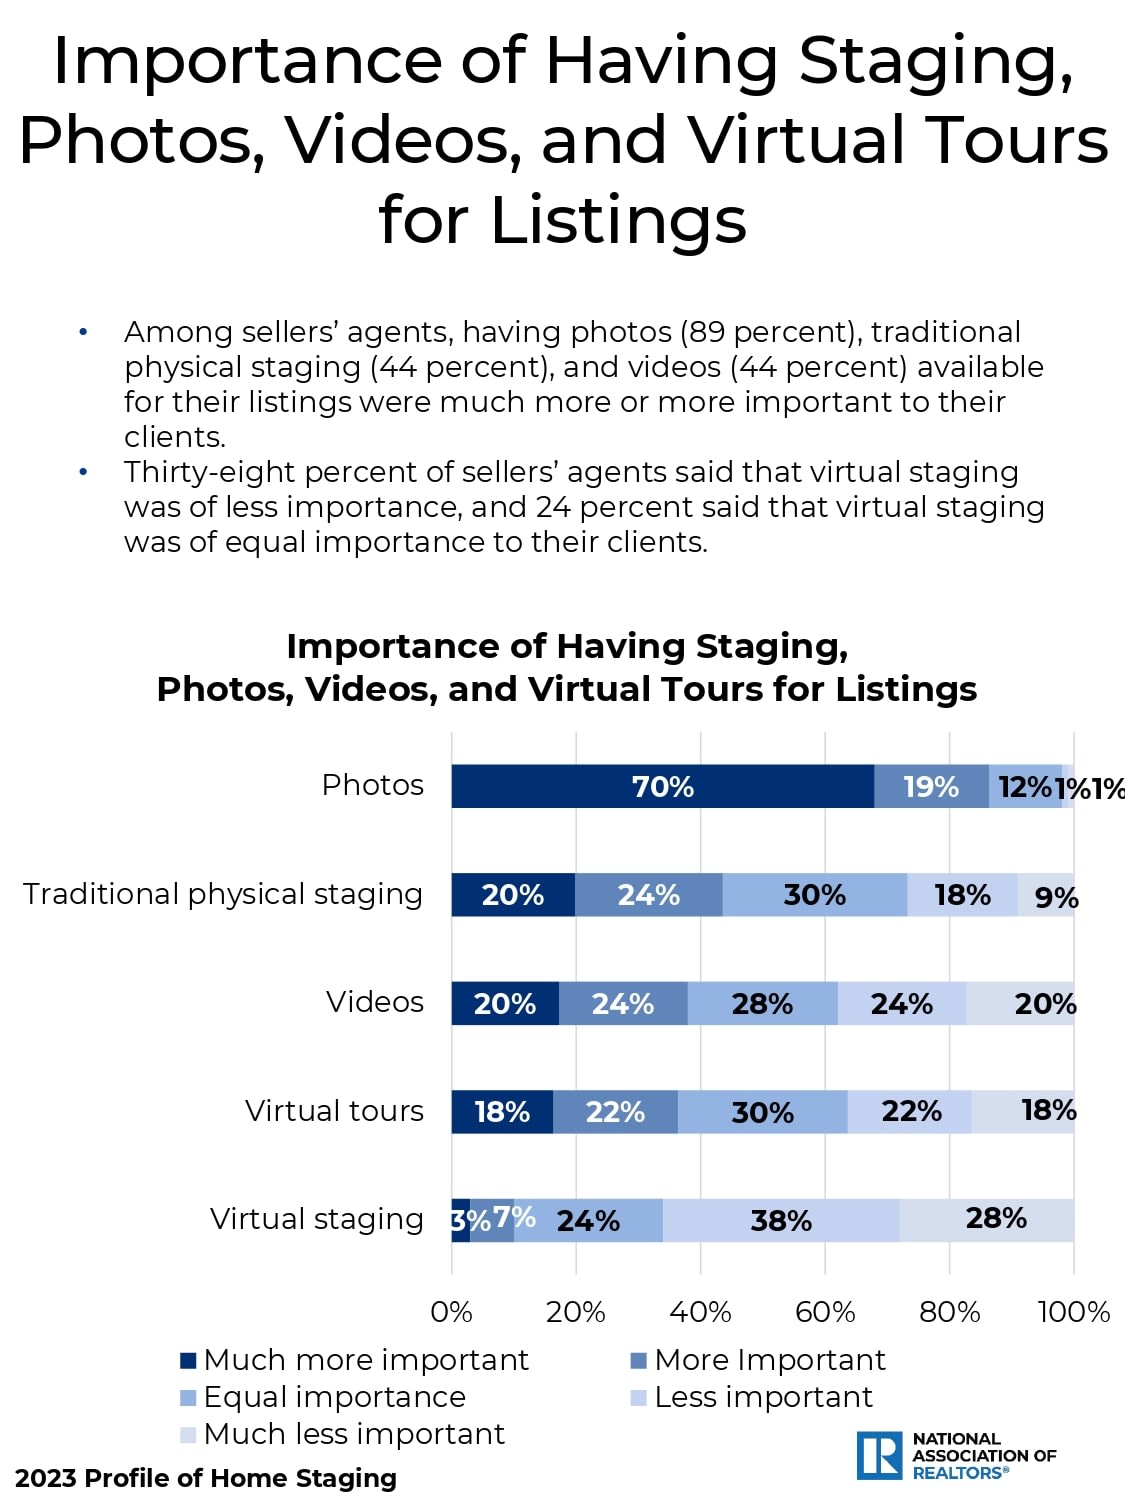
Infographic comparing sellers’ agents’ views on the importance of listing photos, staging, videos, and virtual tours.
Section 3: How TV Shows Influenced Buyers, above a teal sofa in a staged living room.
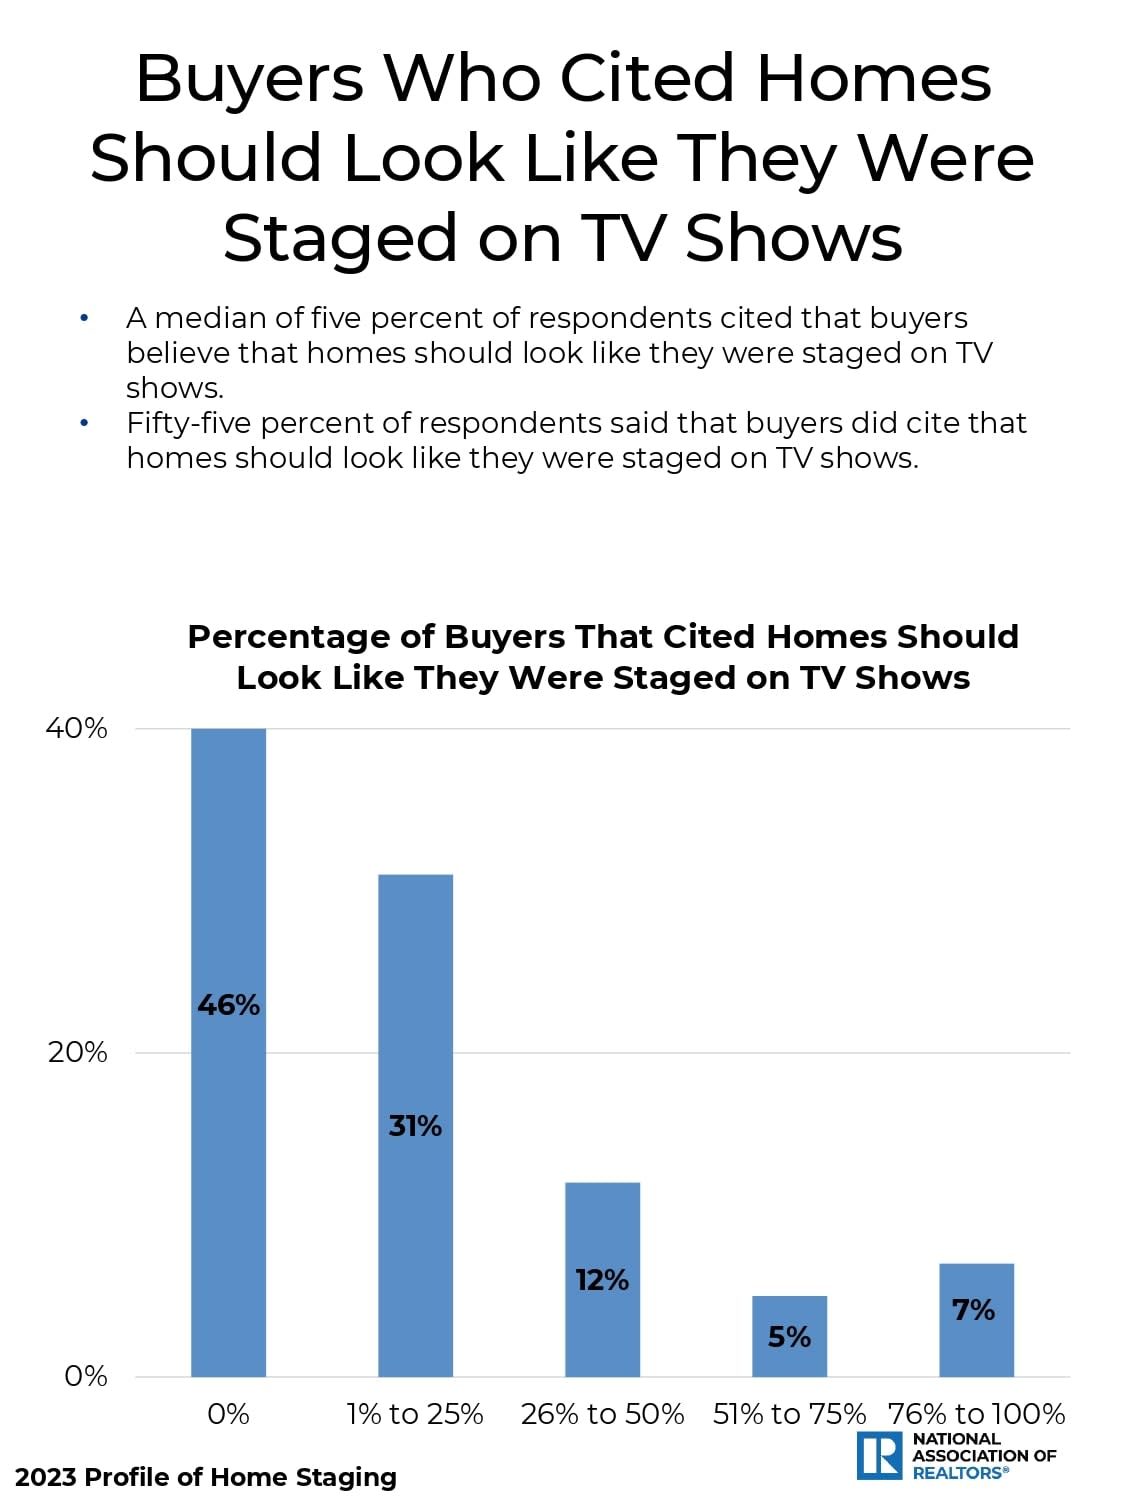
Chart showing responses on TV-style home staging, with percentages from 46% for 0% to 7% for 76% to 100%.
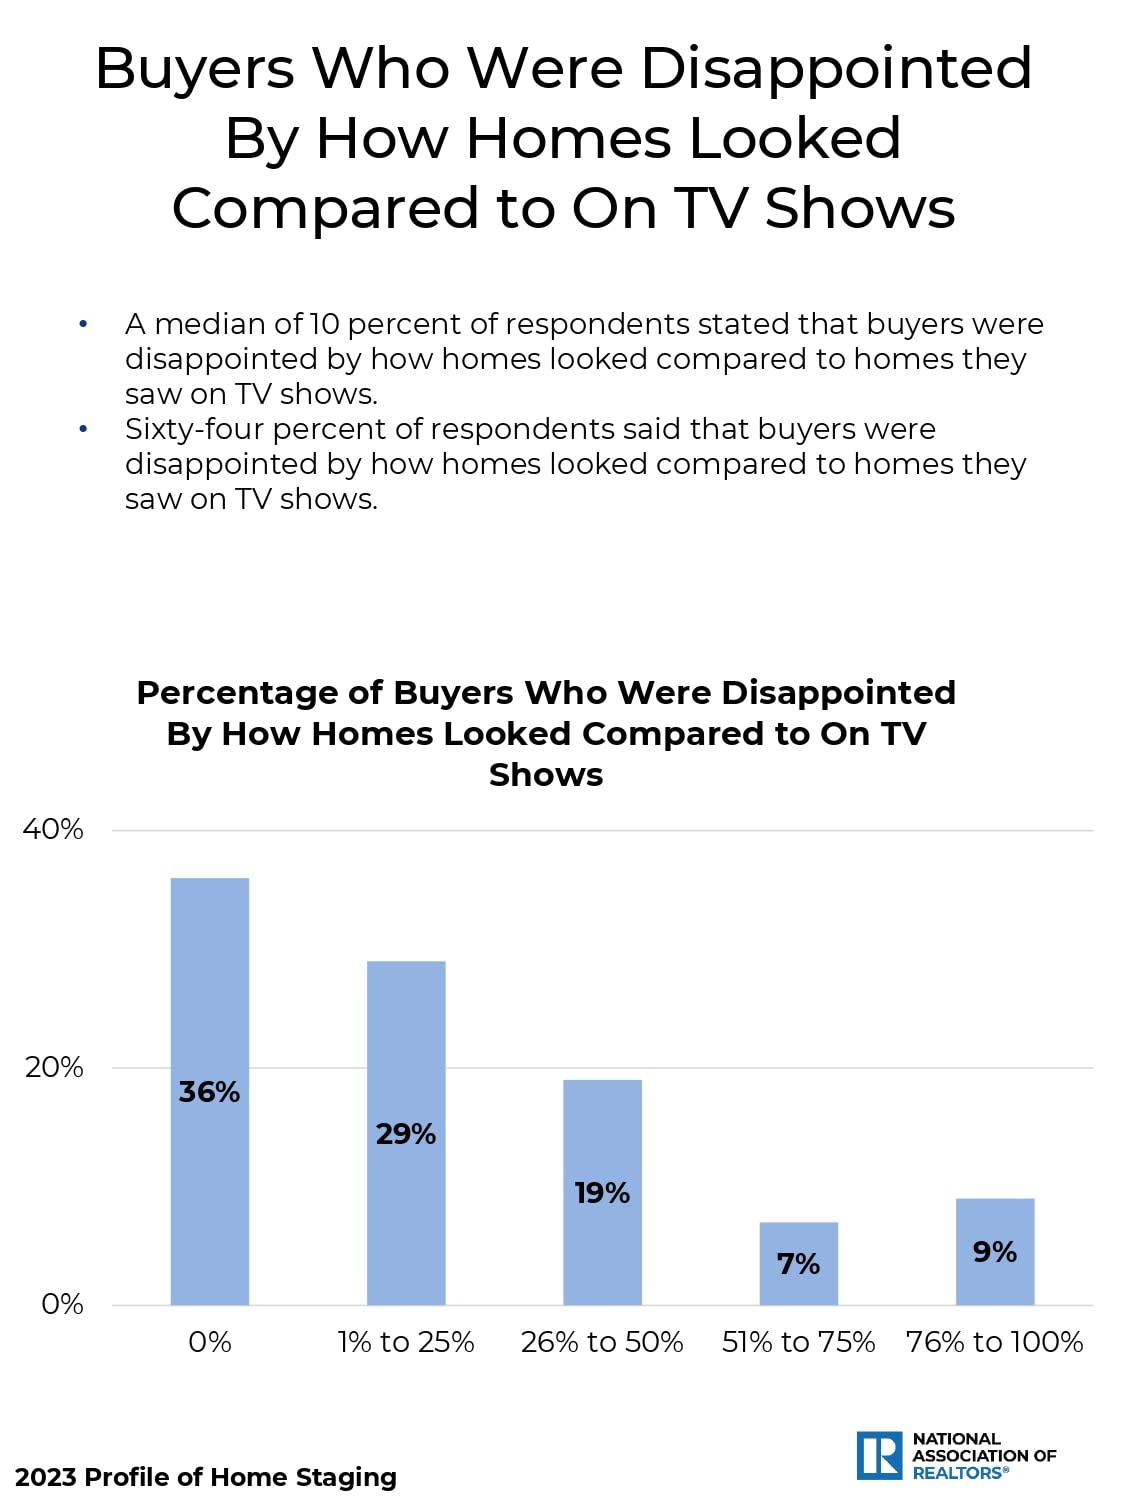
Bar chart of reported buyer disappointment with home appearance compared with homes shown on TV.
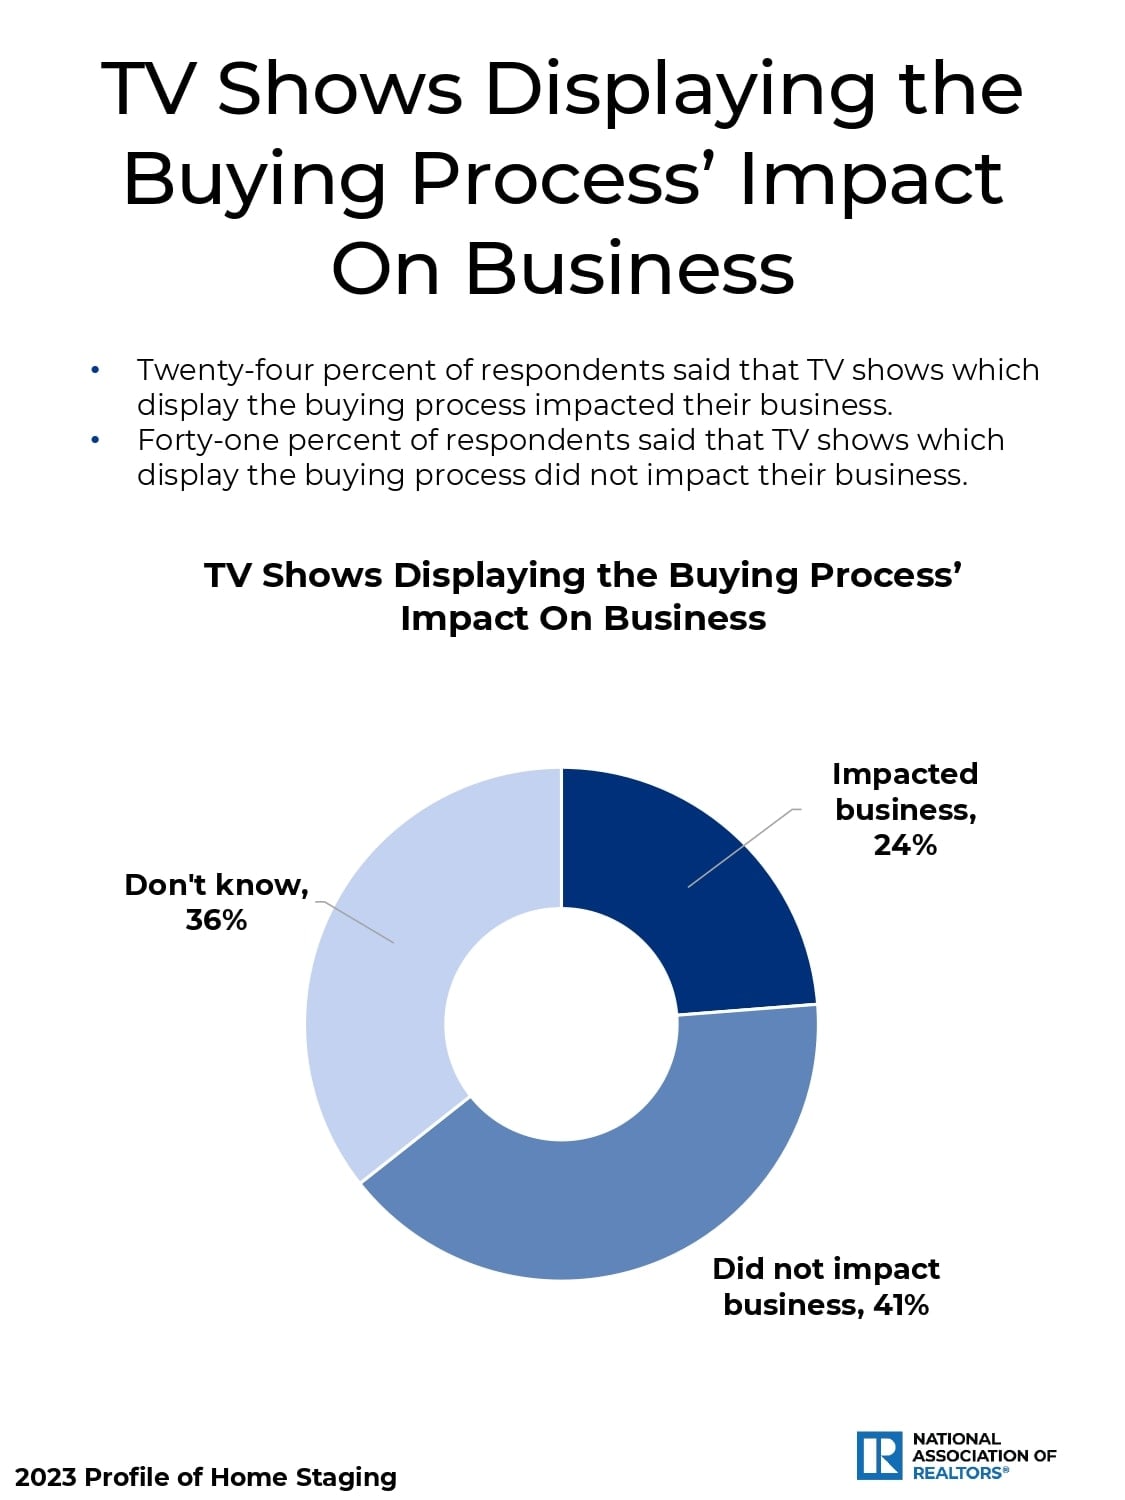
Infographic showing survey responses on the business impact of TV shows depicting the buying process.
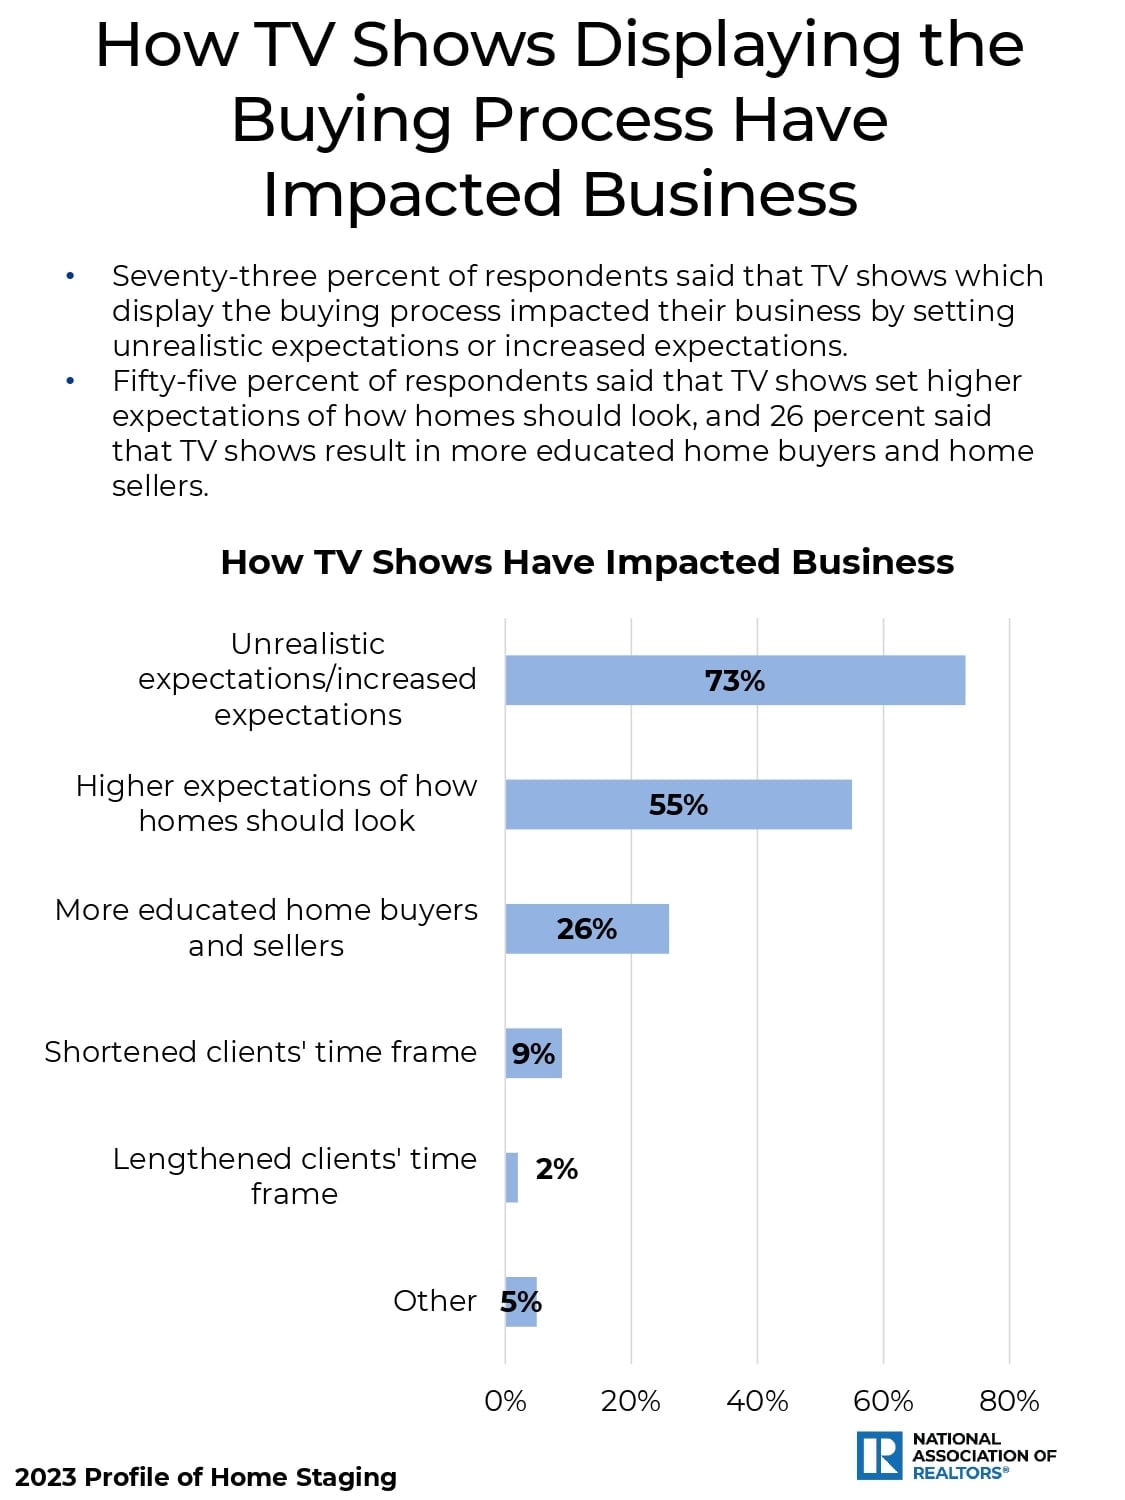
Chart of reported business effects from TV home-buying shows, led by unrealistic expectations at 73%.
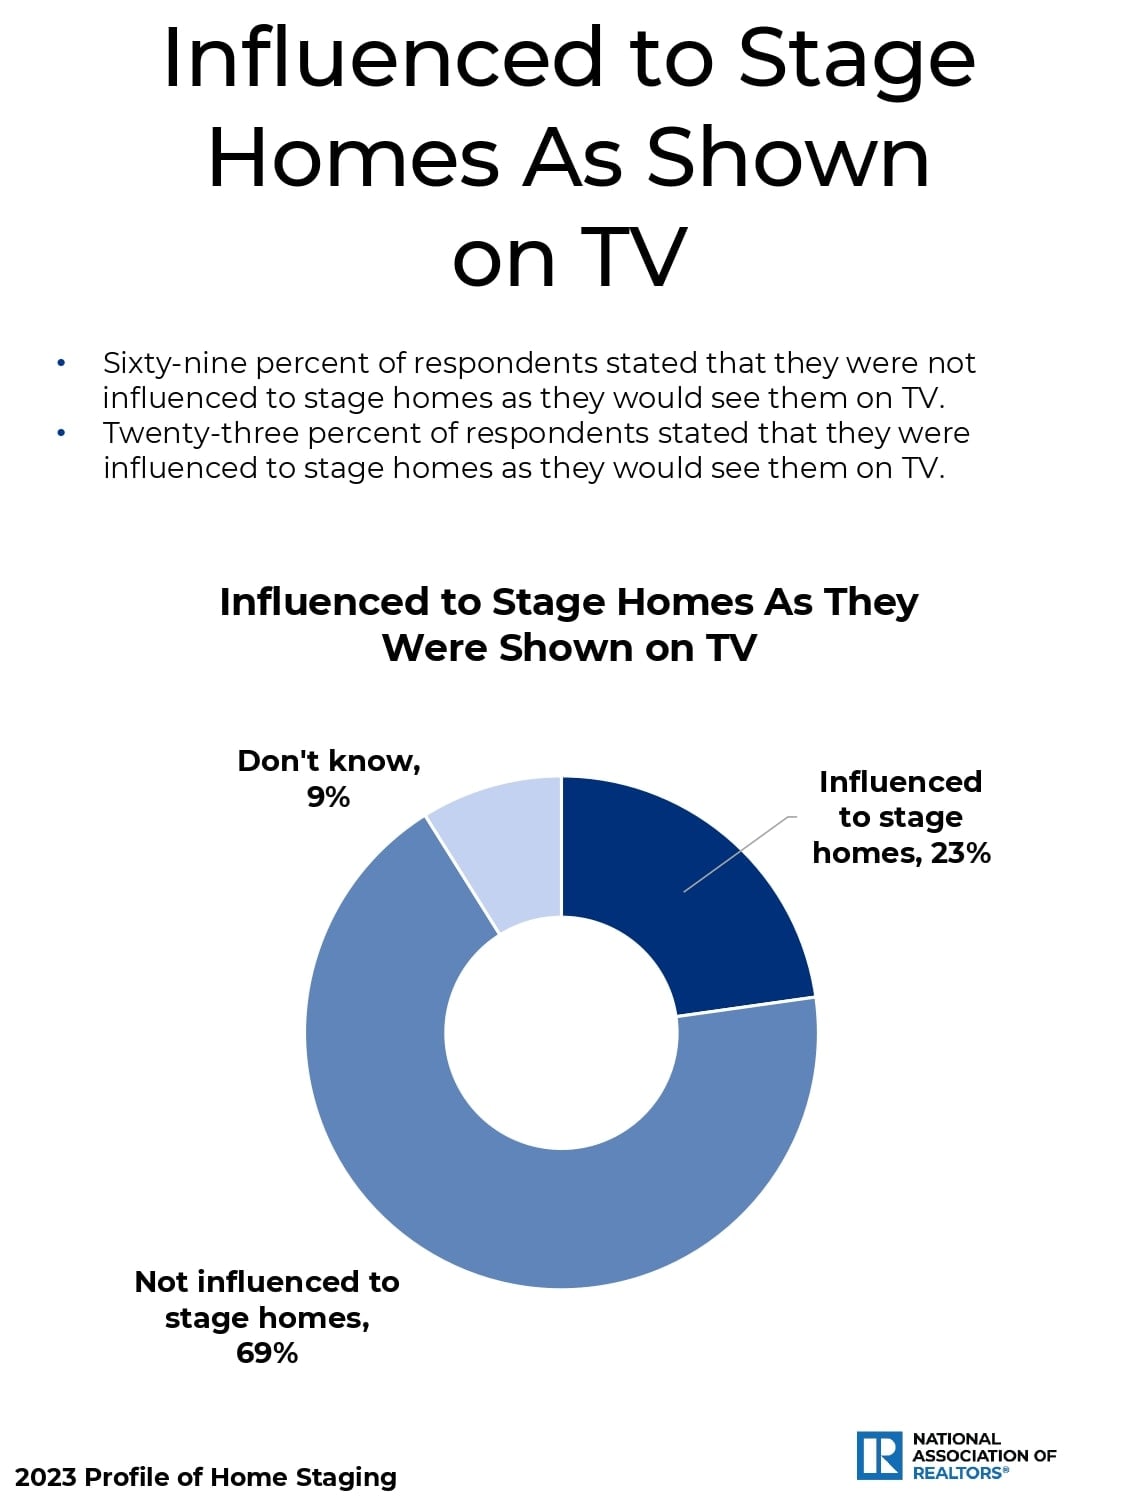
Infographic: 69% were not influenced to stage homes as shown on TV, 23% were influenced, and 9% were unsure.
Section 4: Buyer Expectations
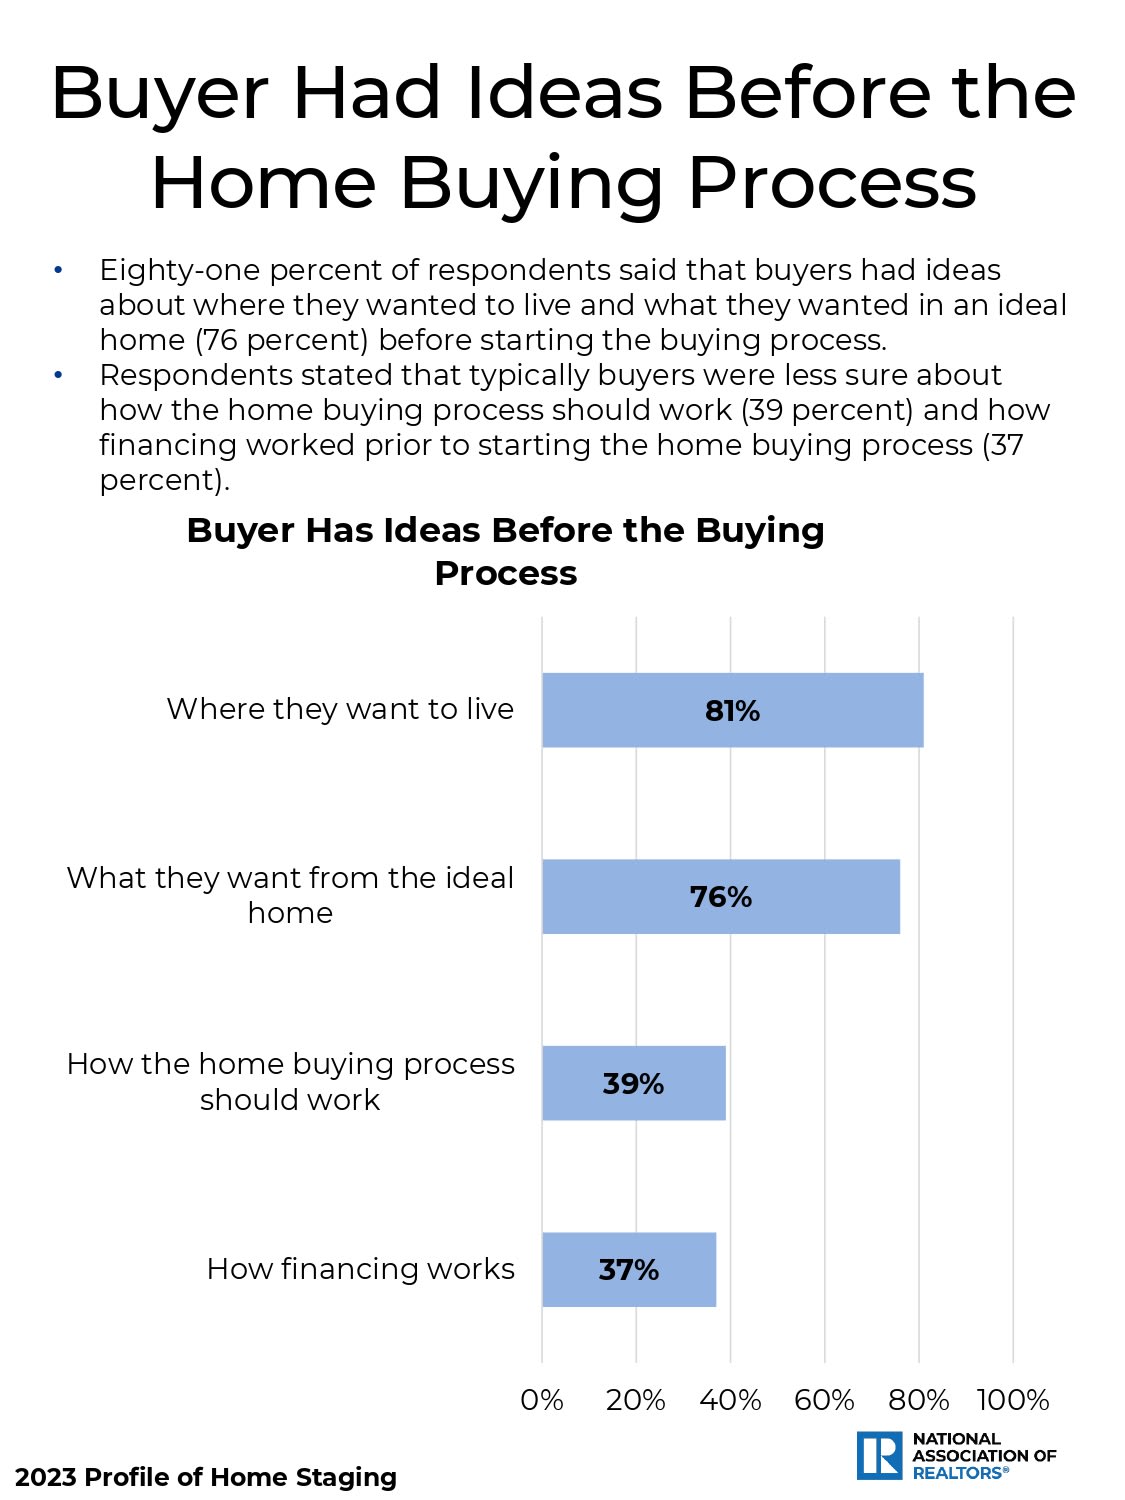
Infographic showing what buyers know before the buying process: location 81%, ideal home 76%, process 39%, financing 37%.
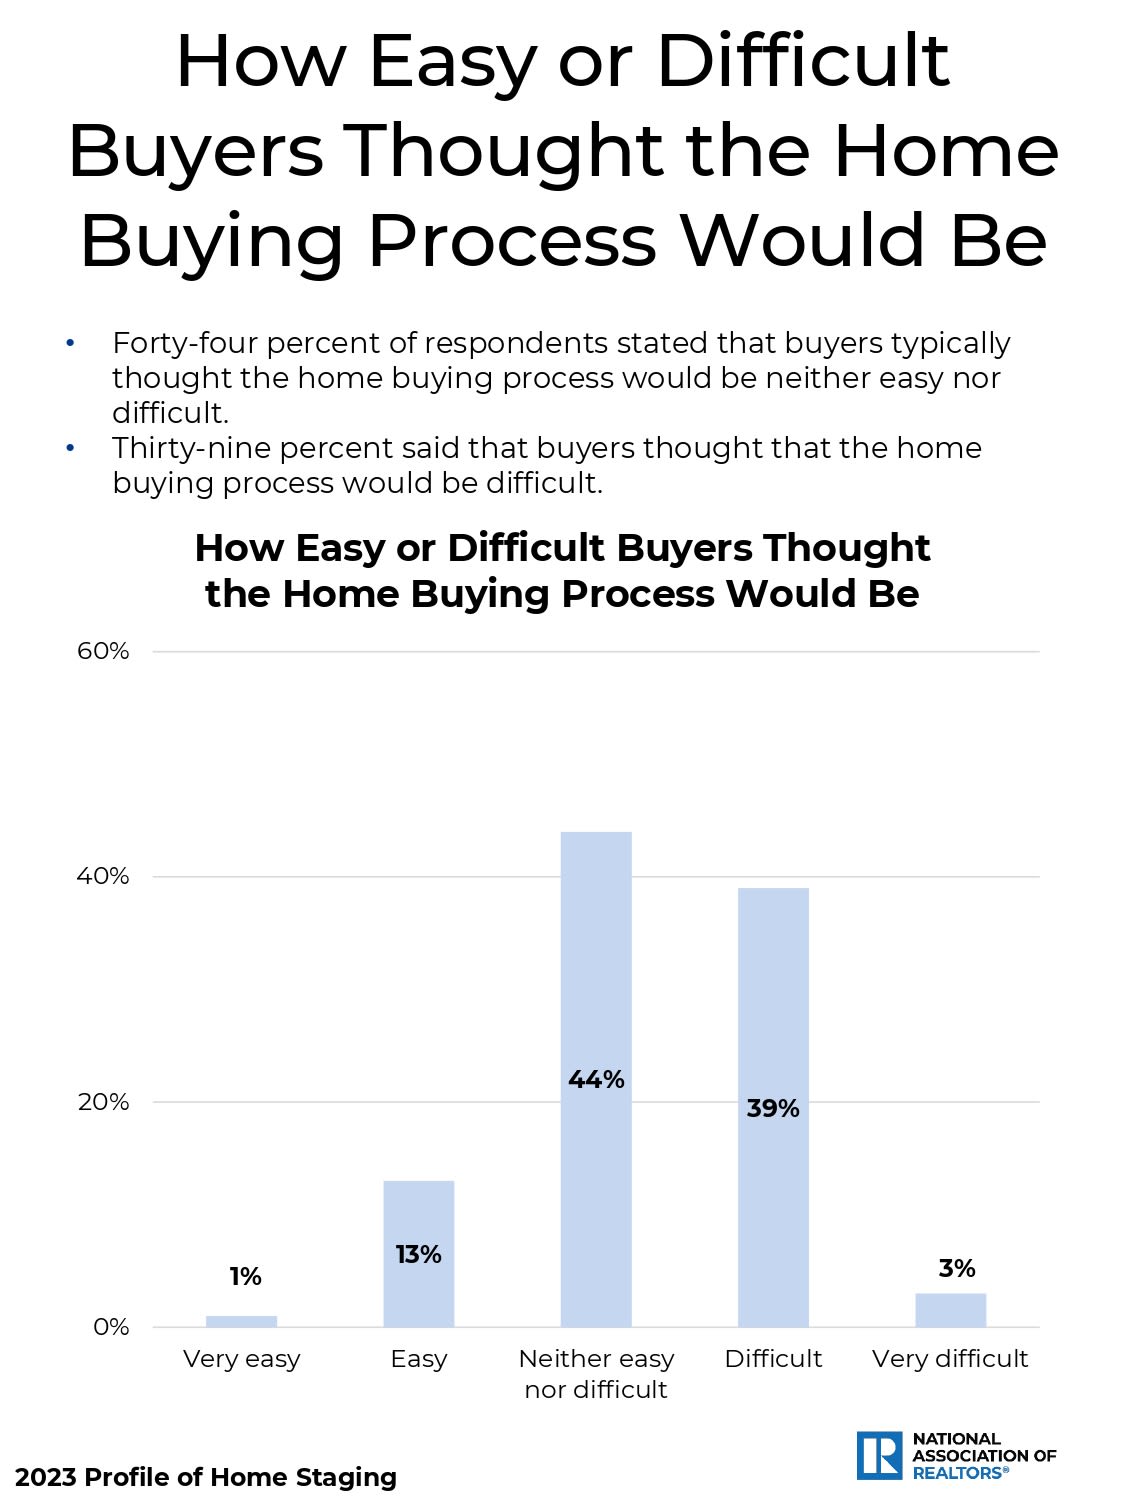
Chart showing buyers’ expectations of the home buying process, with 44% neutral and 39% expecting difficulty.
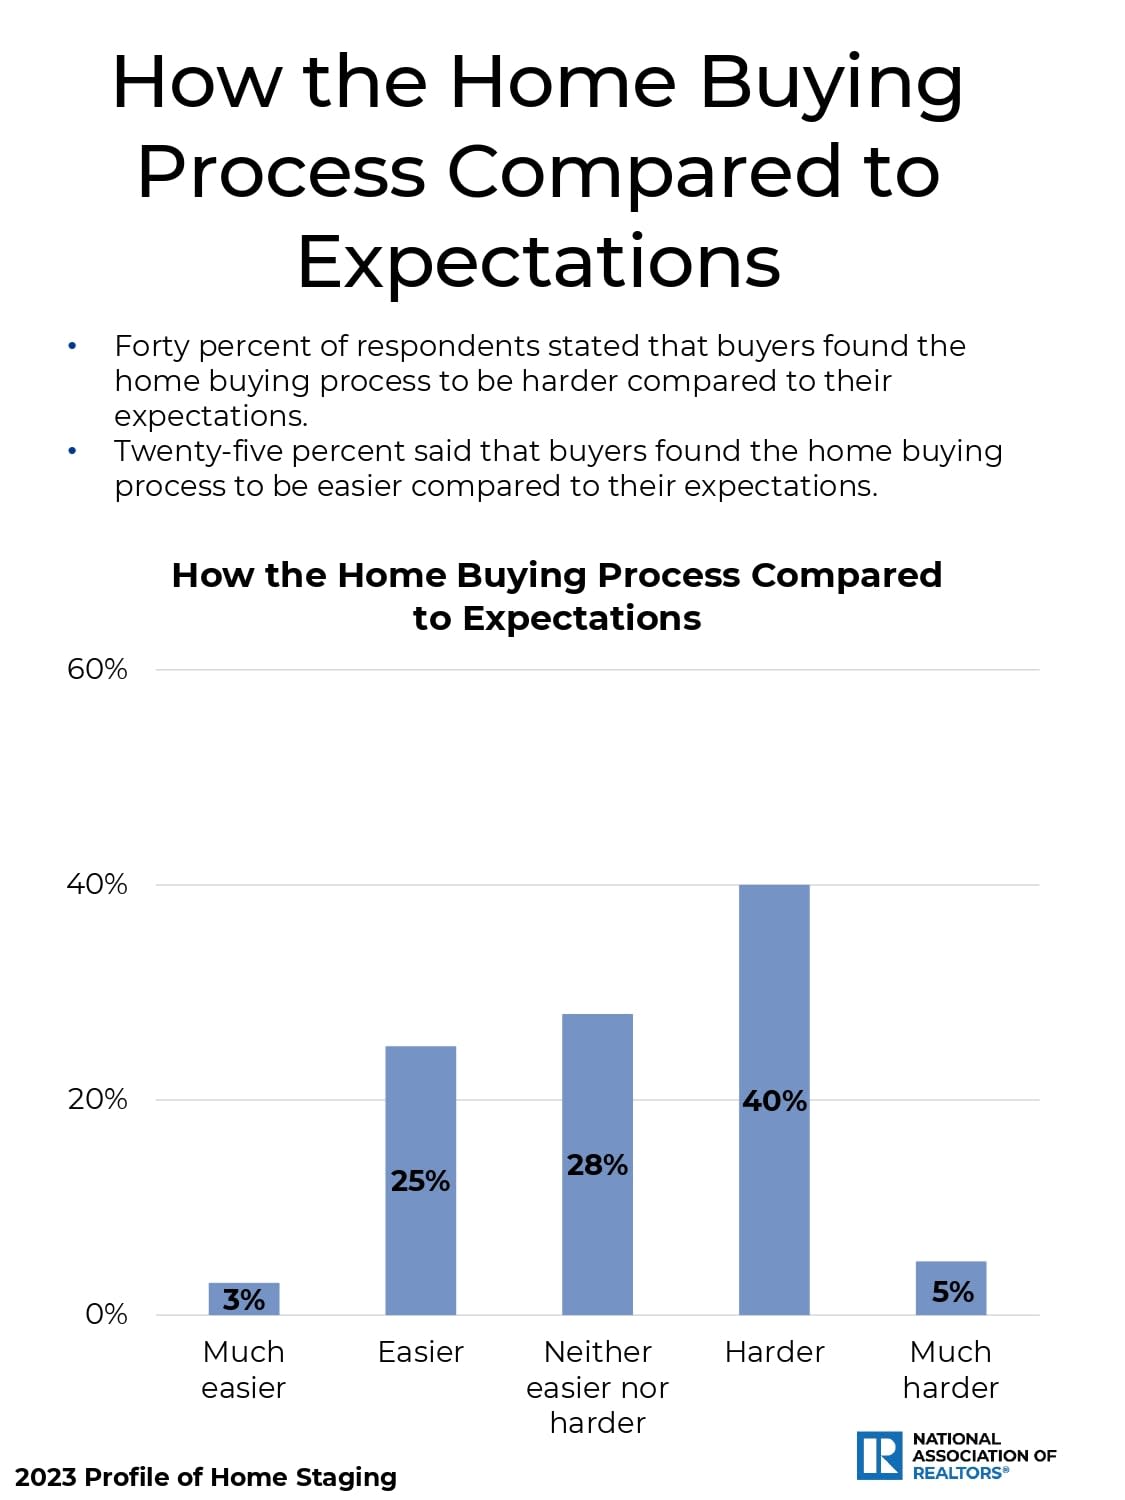
Chart of home-buying expectations: 40% found it harder, 28% neither, 25% easier, 5% much harder, and 3% much easier.
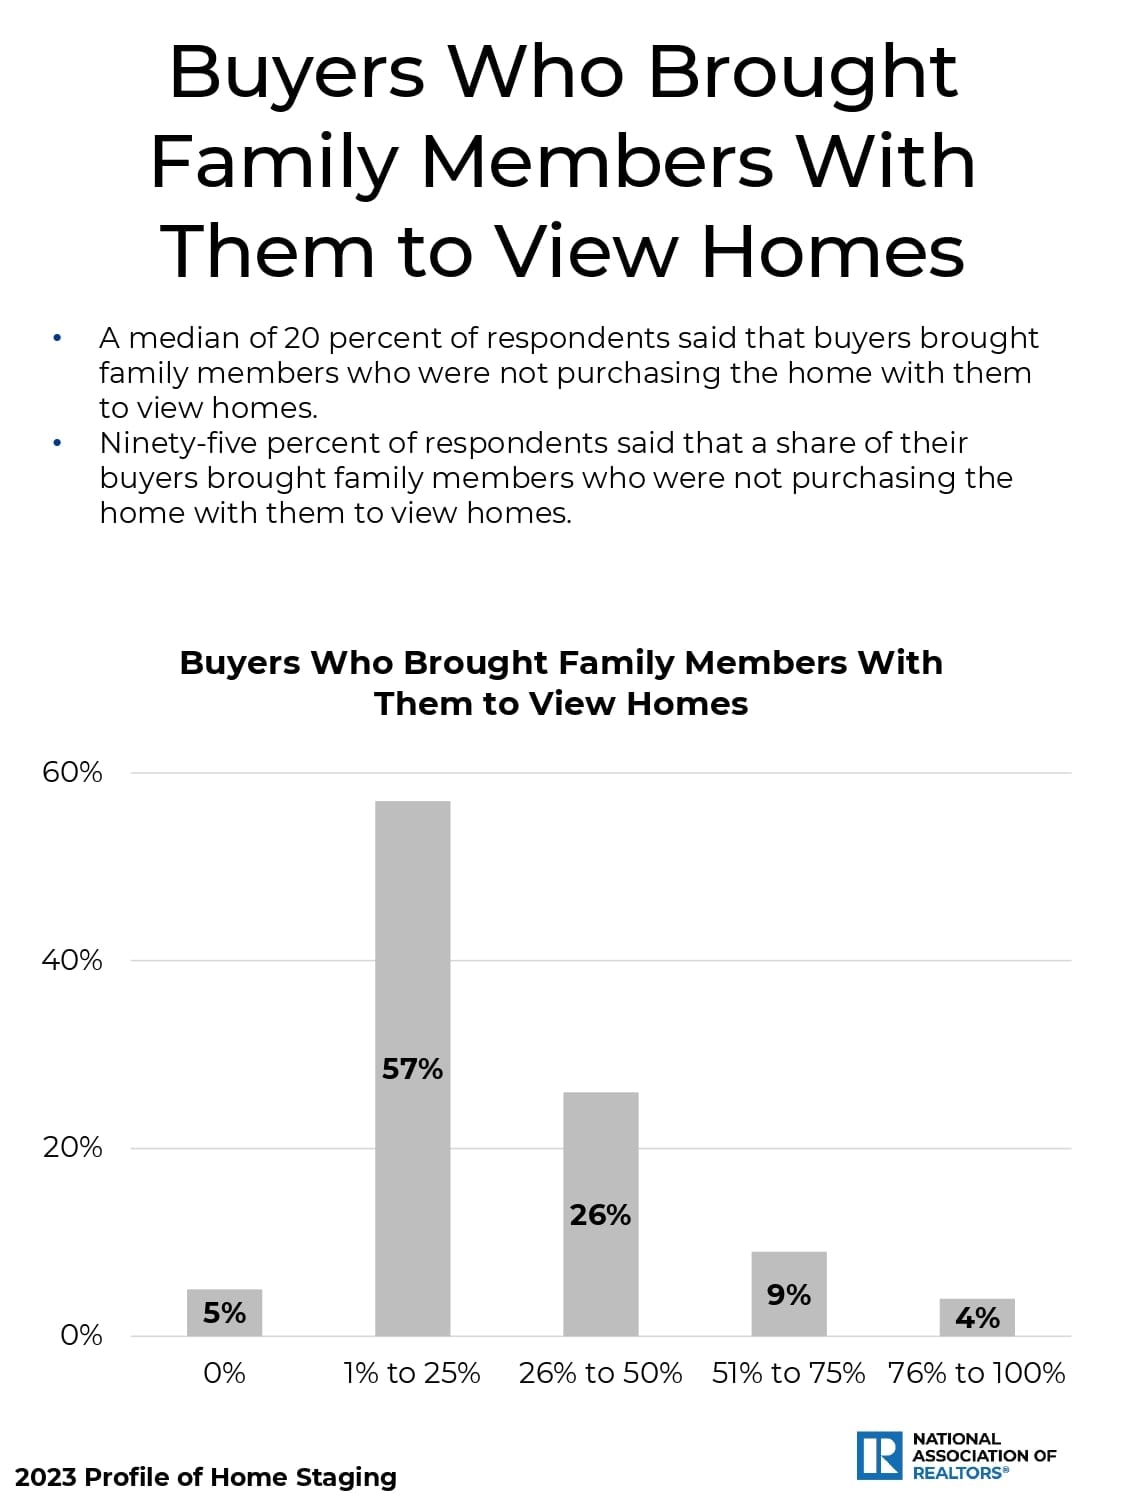
Chart: 57% reported 1–25% of buyers brought non-purchasing family members to view homes; 26% reported 26–50%.
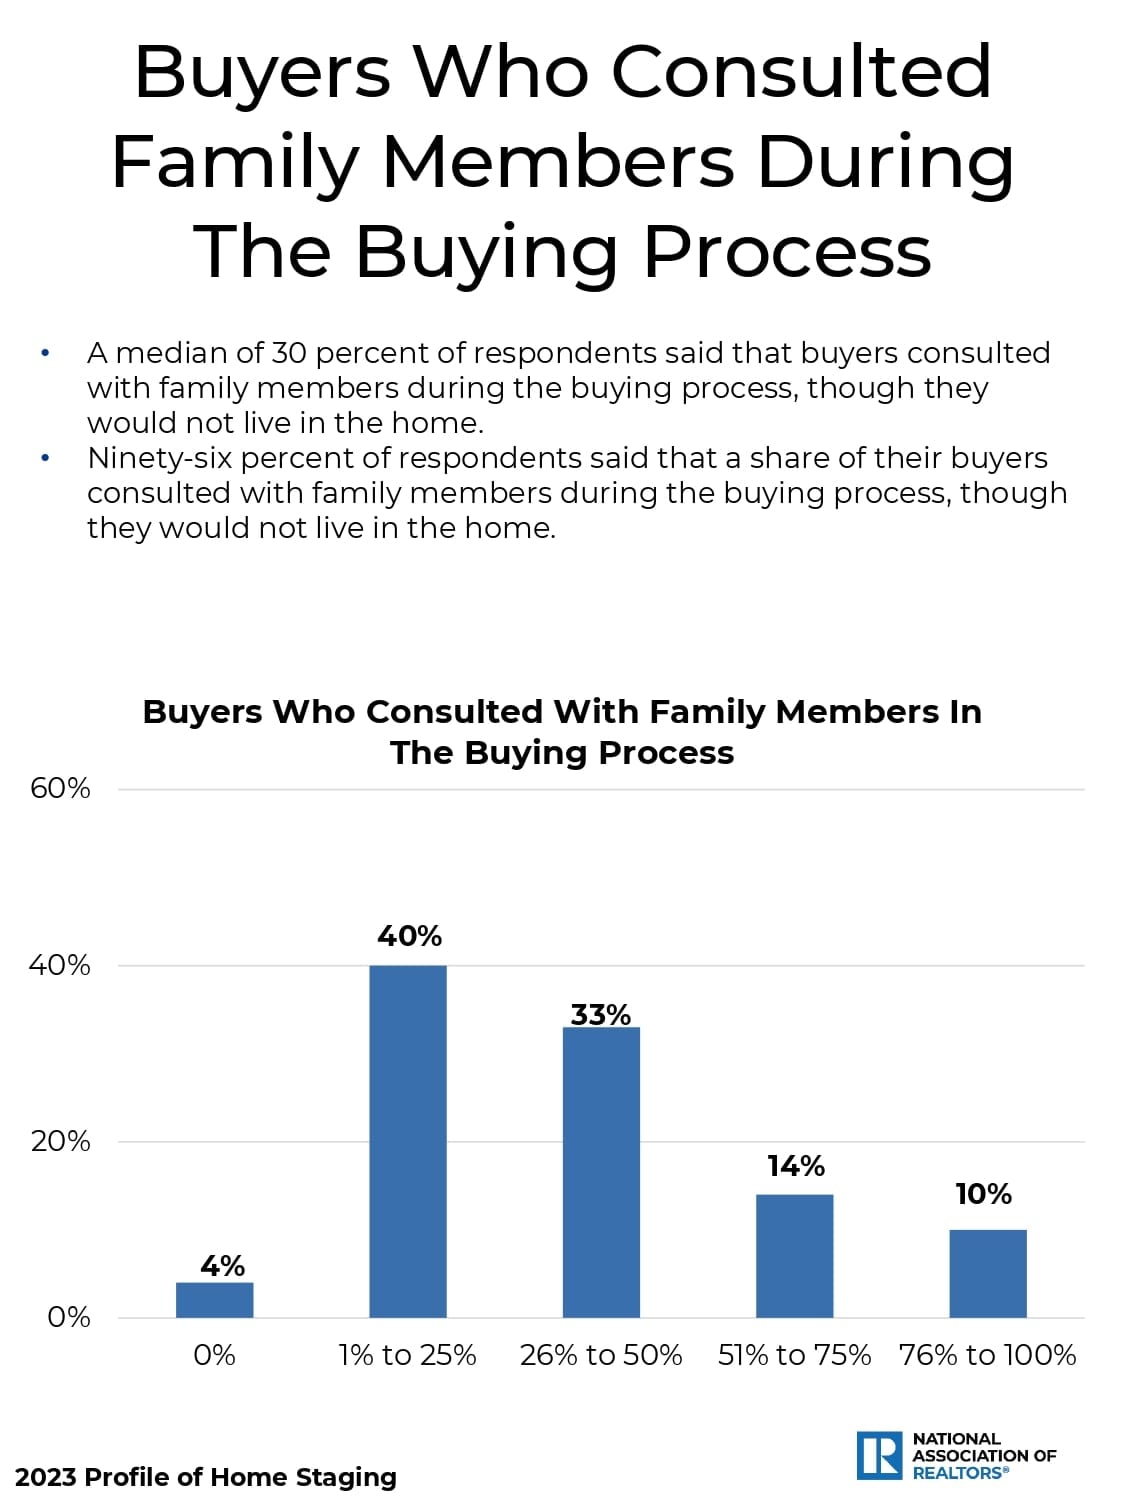
Bar chart on buyers consulting family members during the buying process, with response values from 4% to 40%.
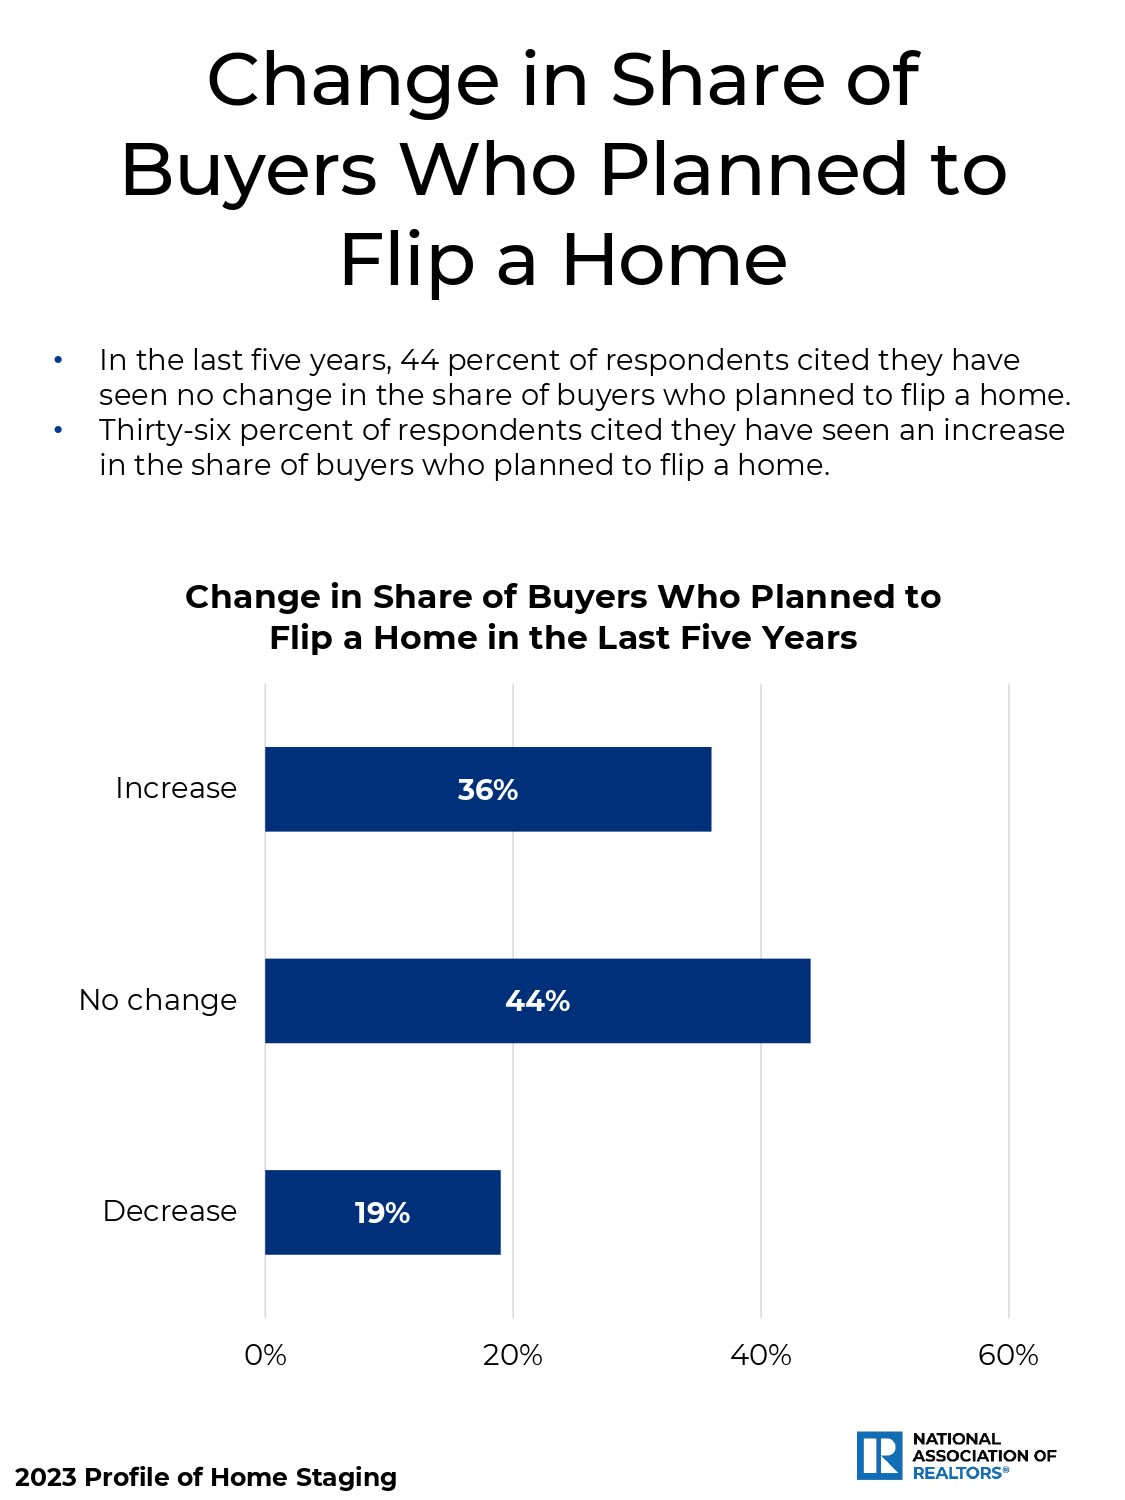
Chart shows buyer plans to flip homes: 36% increase, 44% no change, 19% decrease.
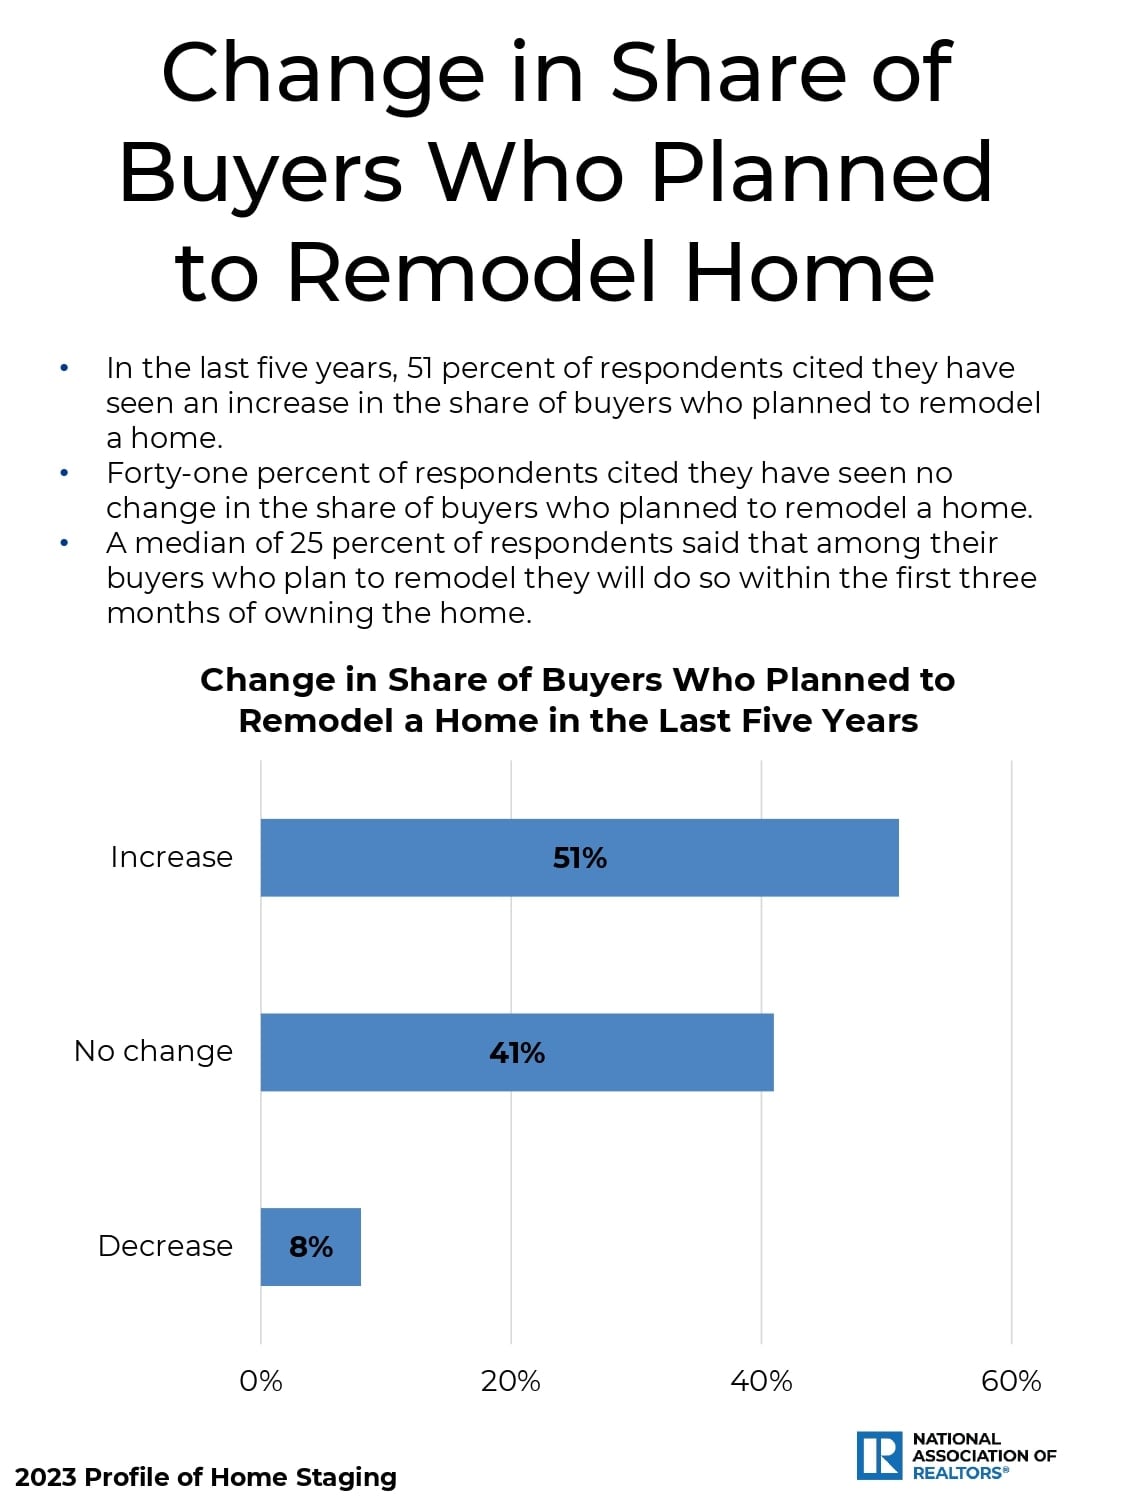
Infographic: 51% saw more buyers planning to remodel, 41% no change, and 8% fewer.
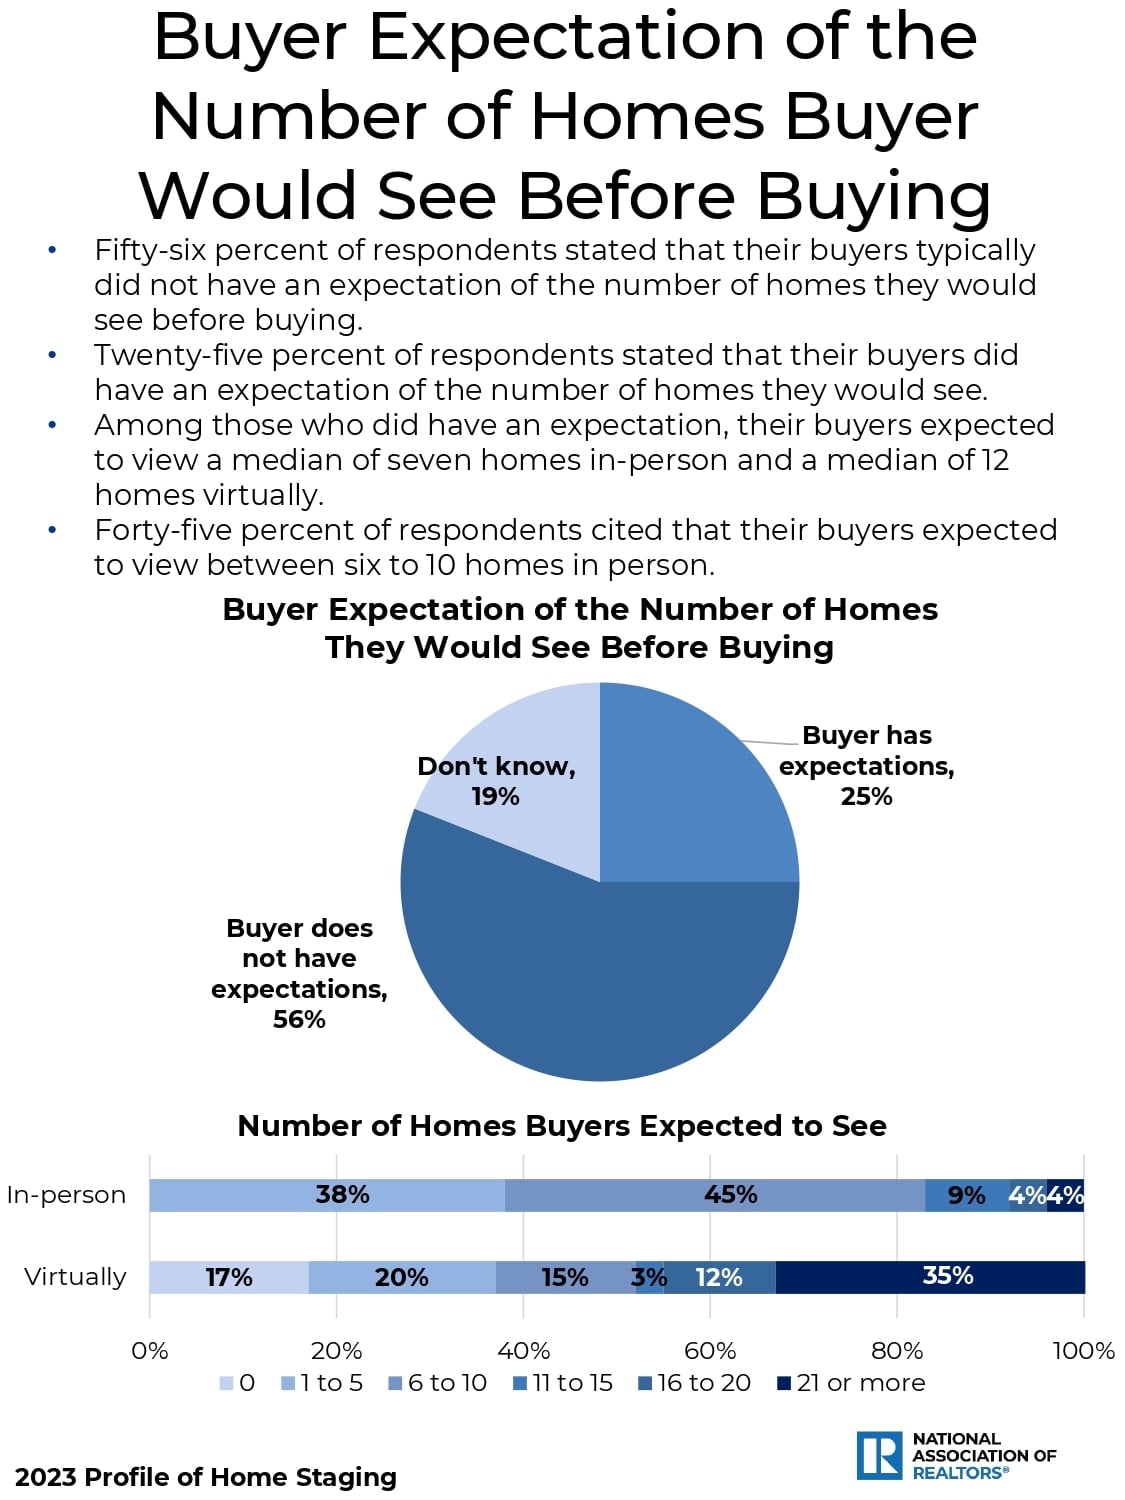
Infographic showing buyers’ expectations for the number of homes viewed in person and virtually.
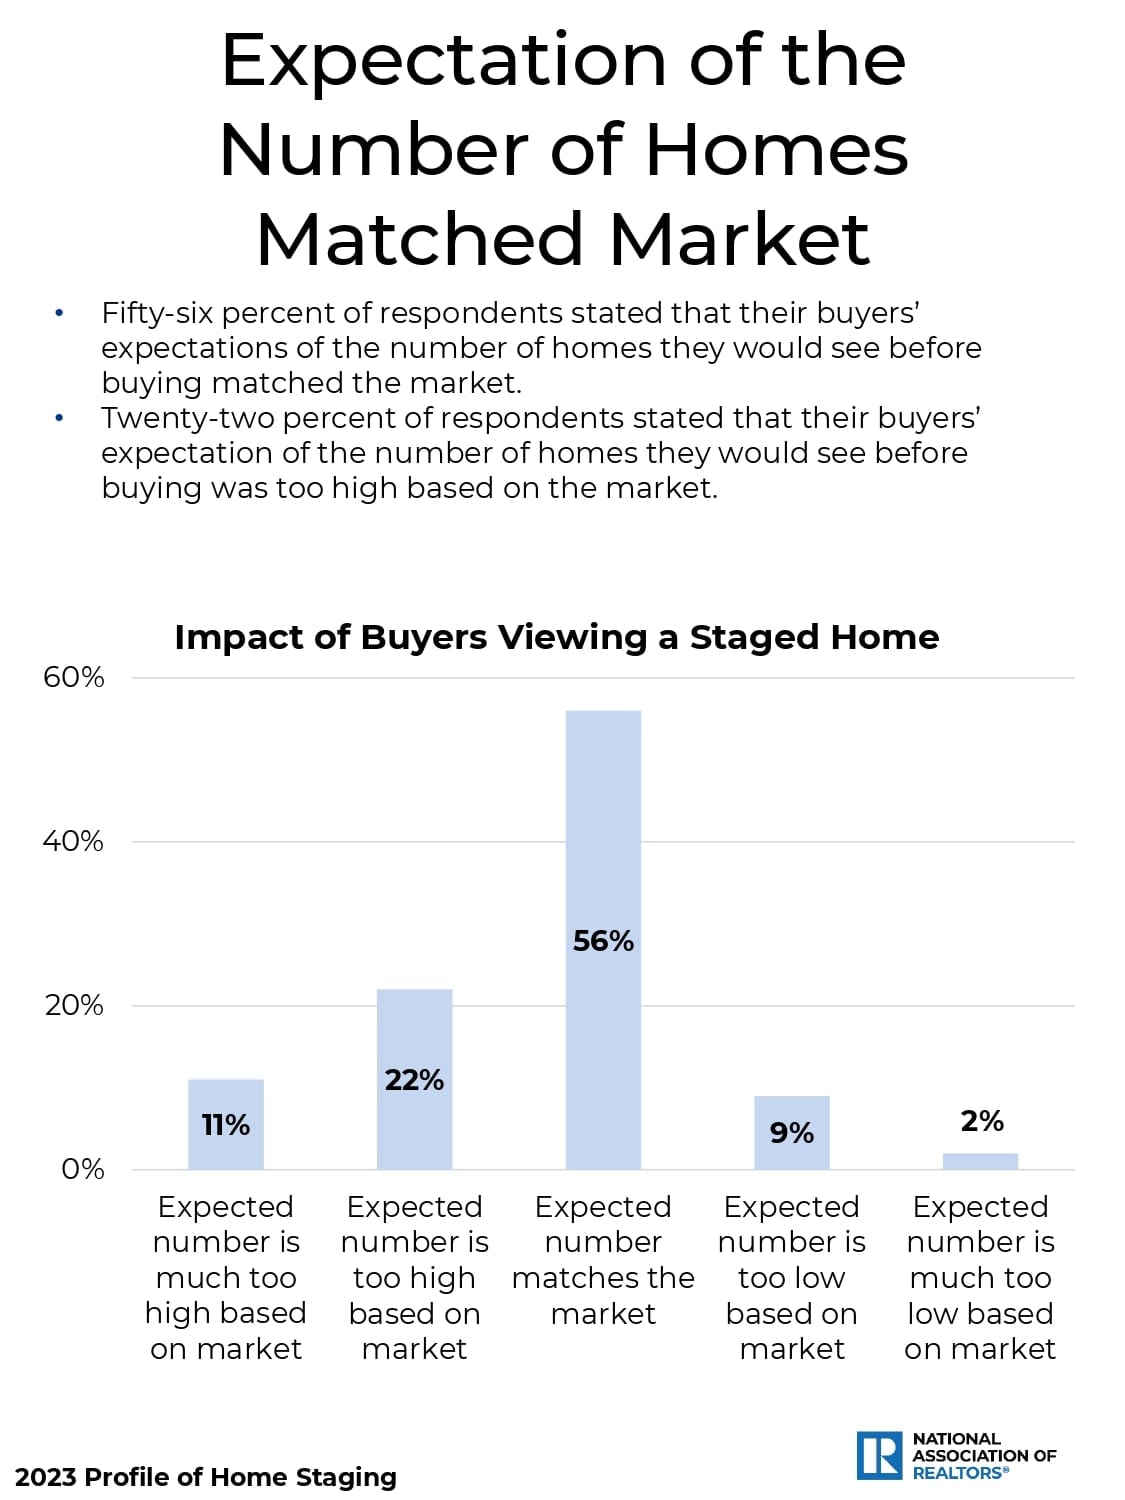
Chart showing buyer expectations for how many homes to view: 56% matched the market, 22% too high, 11% much too high, 9% too low, and 2% much too low.
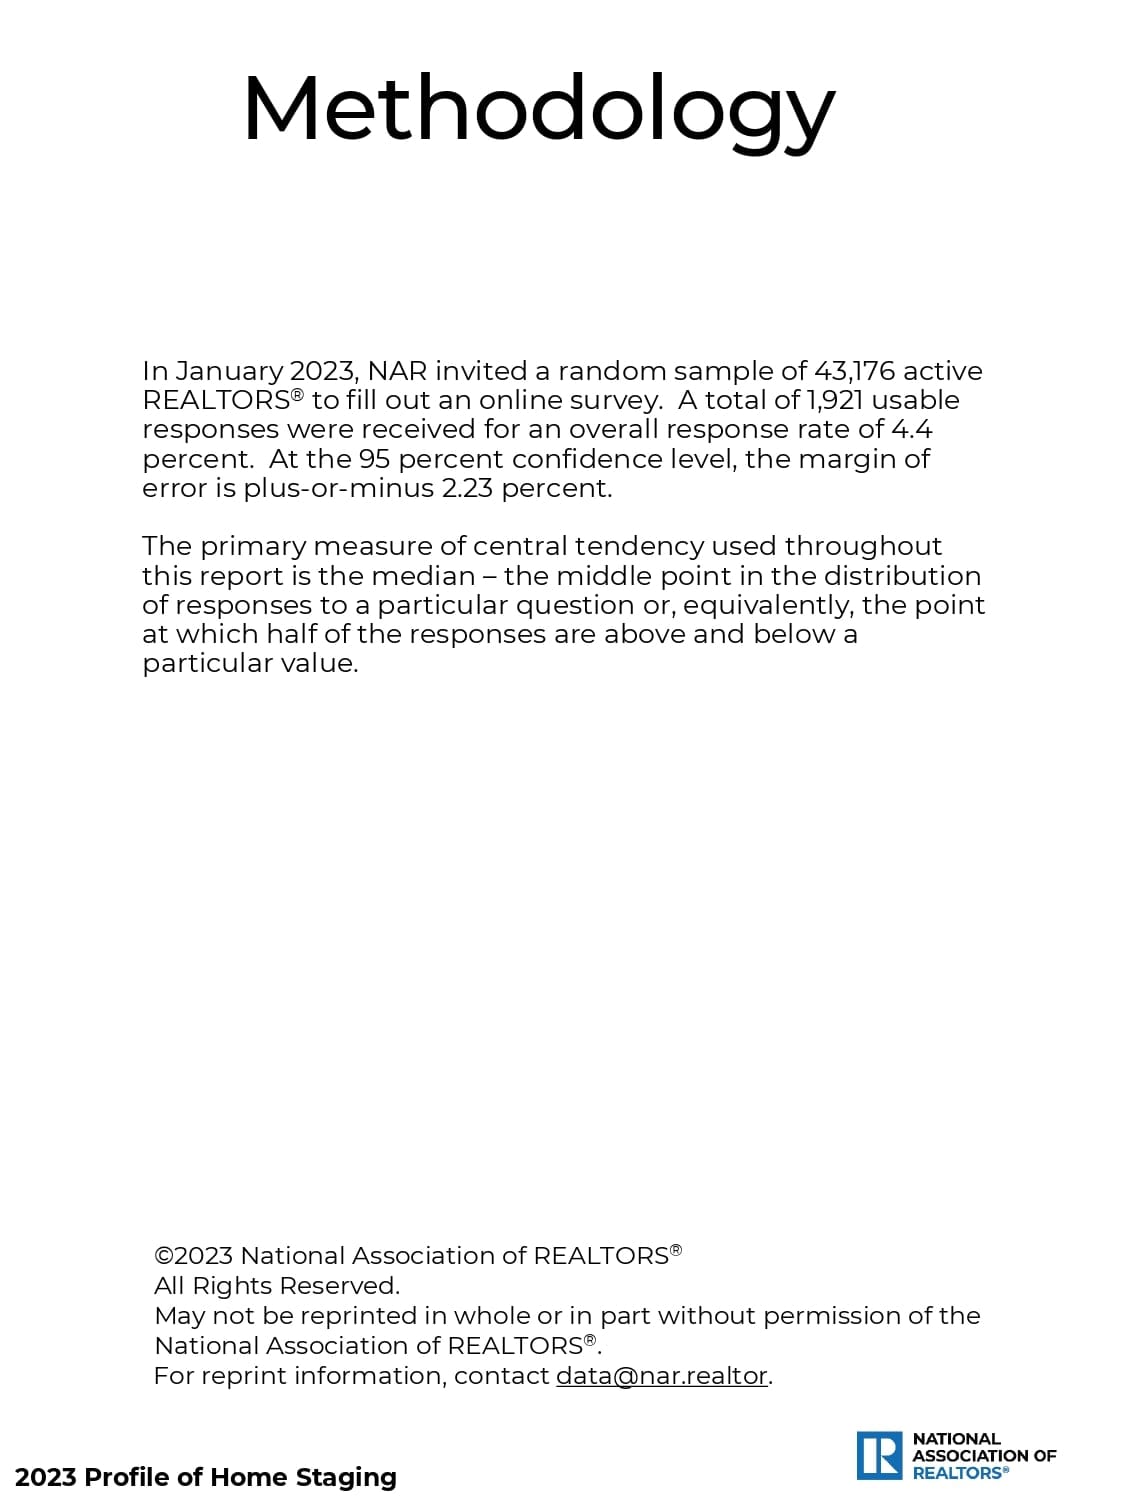
Methodology page describing the 2023 home staging survey and its margin of error.
Page from the 2023 Profile of Home Staging report with National Association of REALTORS® information.